Complete Application Flow
Single-view diagram showing every user action, data movement, AI process, and monetization point in the platform. This is the master blueprint — from first contact through recurring revenue.
"This diagram shows the full system end-to-end — from the moment a PE firm commissions due diligence through every AI process, data store, and revenue trigger. The key takeaway is that every engagement feeds six downstream revenue streams automatically. You don't need to understand every box here — just follow the money tags in gold."
Users & Actions
UI Surfaces
API Services
AI Processing
Data Stores
Revenue / Monetization
Infrastructure
Entry Points — How Users Arrive
PE / VC Firm
Commissions DD on a target company
Commissions DD on a target company
Target Company
Invited to upload docs to VDR
Invited to upload docs to VDR
Self-Serve Company
Purchases automated DD
Purchases automated DD
Valeon Consultant
Manages engagement end-to-end
Manages engagement end-to-end
Marketplace Subscriber
Browses anonymized scored profiles
Browses anonymized scored profiles
$ Pay Per Project: $3.5K-$150K
$ Marketplace Subscription: $2-5K/mo
▼ ▼ ▼
Engagement Setup — Backend Advisory Portal
Create Engagement
Scope, DD type, pricing tier
Scope, DD type, pricing tier
Capture Consent
Marketplace opt-in, KPI opt-in
Marketplace opt-in, KPI opt-in
Generate VDR Link
Encrypted, per-engagement key
Encrypted, per-engagement key
Invite Target Company
Secure email notification
Secure email notification
▼ ▼ ▼
Document Intake — VDR & AI Processing
Target Uploads Docs
Financials, contracts, code, configs
Financials, contracts, code, configs
OCR + Text Extract
LLM: Fast tier
LLM: Fast tier
PII Detection
Regex + LLM fallback
Regex + LLM fallback
Document Classifier
Categorize by DD track
Categorize by DD track
Chunk + Embed
→ Vector Store for RAG
→ Vector Store for RAG
Gap Analysis
What documents are missing?
What documents are missing?
Auto-Generate Data Request List
Sent to target for follow-up
Sent to target for follow-up
Target Uploads More → Re-Process
Iterative until complete
Iterative until complete
▼ ▼ ▼
AI Analysis — Specialized Agents (Parallel Execution)
Technology Agent
Architecture, Infra, SDLC, Security, DevOps
Architecture, Infra, SDLC, Security, DevOps
Finance Agent
QoE, Revenue, Cost, Working Capital, Debt
QoE, Revenue, Cost, Working Capital, Debt
Commercial Agent
Customers, Sales, Pricing, Concentration
Customers, Sales, Pricing, Concentration
Market Agent
TAM, Competition, Barriers, Growth
TAM, Competition, Barriers, Growth
Compliance Agent
ESG, GDPR, SOX, Regulatory
ESG, GDPR, SOX, Regulatory
Cybersecurity Agent
Vuln assessment, posture, incident history
Vuln assessment, posture, incident history
Rules & Definitions Engine — Configurable scoring taxonomy → Normalized 0-100 scores per track
AI confidence scores gate human review: <85% → mandatory consultant override
AI confidence scores gate human review: <85% → mandatory consultant override
LLM Gateway — Multi-model routing: Fast (classify) → Mid (gaps) → Powerful (analysis, reports)
Token budgeting per engagement, cost tracking, model fallback chain
Token budgeting per engagement, cost tracking, model fallback chain
▼ ▼ ▼
Report Generation & Client Delivery
Report Builder
AI drafts structured report
AI drafts structured report
Consultant Review
Override scores + edit narrative
Override scores + edit narrative
Version-Controlled Storage
Report DB + Rating DB
Report DB + Rating DB
Client Report Portal
Interactive, Q&A, amendments
Interactive, Q&A, amendments
Export Engine
Excel, PowerPoint, PDF export
Excel, PowerPoint, PDF export
▼ ▼ ▼
Post-Engagement — Data Compounds Into 6 Revenue Streams
Industry Clusterer
Auto-groups companies by vertical
$ Competitor Scoring: $5-15K/report
Auto-groups companies by vertical
$ Competitor Scoring: $5-15K/report
Anonymizer → Marketplace
Opt-in companies listed (no names)
$ Intro Fees: $1-5K each
Opt-in companies listed (no names)
$ Intro Fees: $1-5K each
KPI Tracking Activation
Baseline scores → ongoing monitoring
$ KPI SaaS: $500-5K/mo
Baseline scores → ongoing monitoring
$ KPI SaaS: $500-5K/mo
Cap Markets Alert
High scores → deal pipeline
$ IB Fees: 3-5% of $5-15M deals
High scores → deal pipeline
$ IB Fees: 3-5% of $5-15M deals
Stagnation Detector
Plateau → service recommendation
$ Services: $400-500/hr
Plateau → service recommendation
$ Services: $400-500/hr
Investment Intelligence
Low score + fixable = invest
$ Equity: 1-3 deals/yr
Low score + fixable = invest
$ Equity: 1-3 deals/yr
▼ ▼ ▼
Recurring Revenue Loops — The Flywheel
KPI SaaS Loop
Track scores → Detect stagnation → Recommend services → Valeon engagement → Score improves → Continue tracking
Track scores → Detect stagnation → Recommend services → Valeon engagement → Score improves → Continue tracking
Marketplace Loop
PE browses → Requests intro → Valeon mediates → PE commissions DD → New company scored → Marketplace grows
PE browses → Requests intro → Valeon mediates → PE commissions DD → New company scored → Marketplace grows
Cap Markets Loop
Company scored high → Valeon pursues IB mandate → Fundraise success → More companies want DD → Brand strengthens
Company scored high → Valeon pursues IB mandate → Fundraise success → More companies want DD → Brand strengthens
Data Compound Loop
More DDs → Deeper benchmarks → Better competitor scoring → More valuable marketplace → Higher prices justified
More DDs → Deeper benchmarks → Better competitor scoring → More valuable marketplace → Higher prices justified
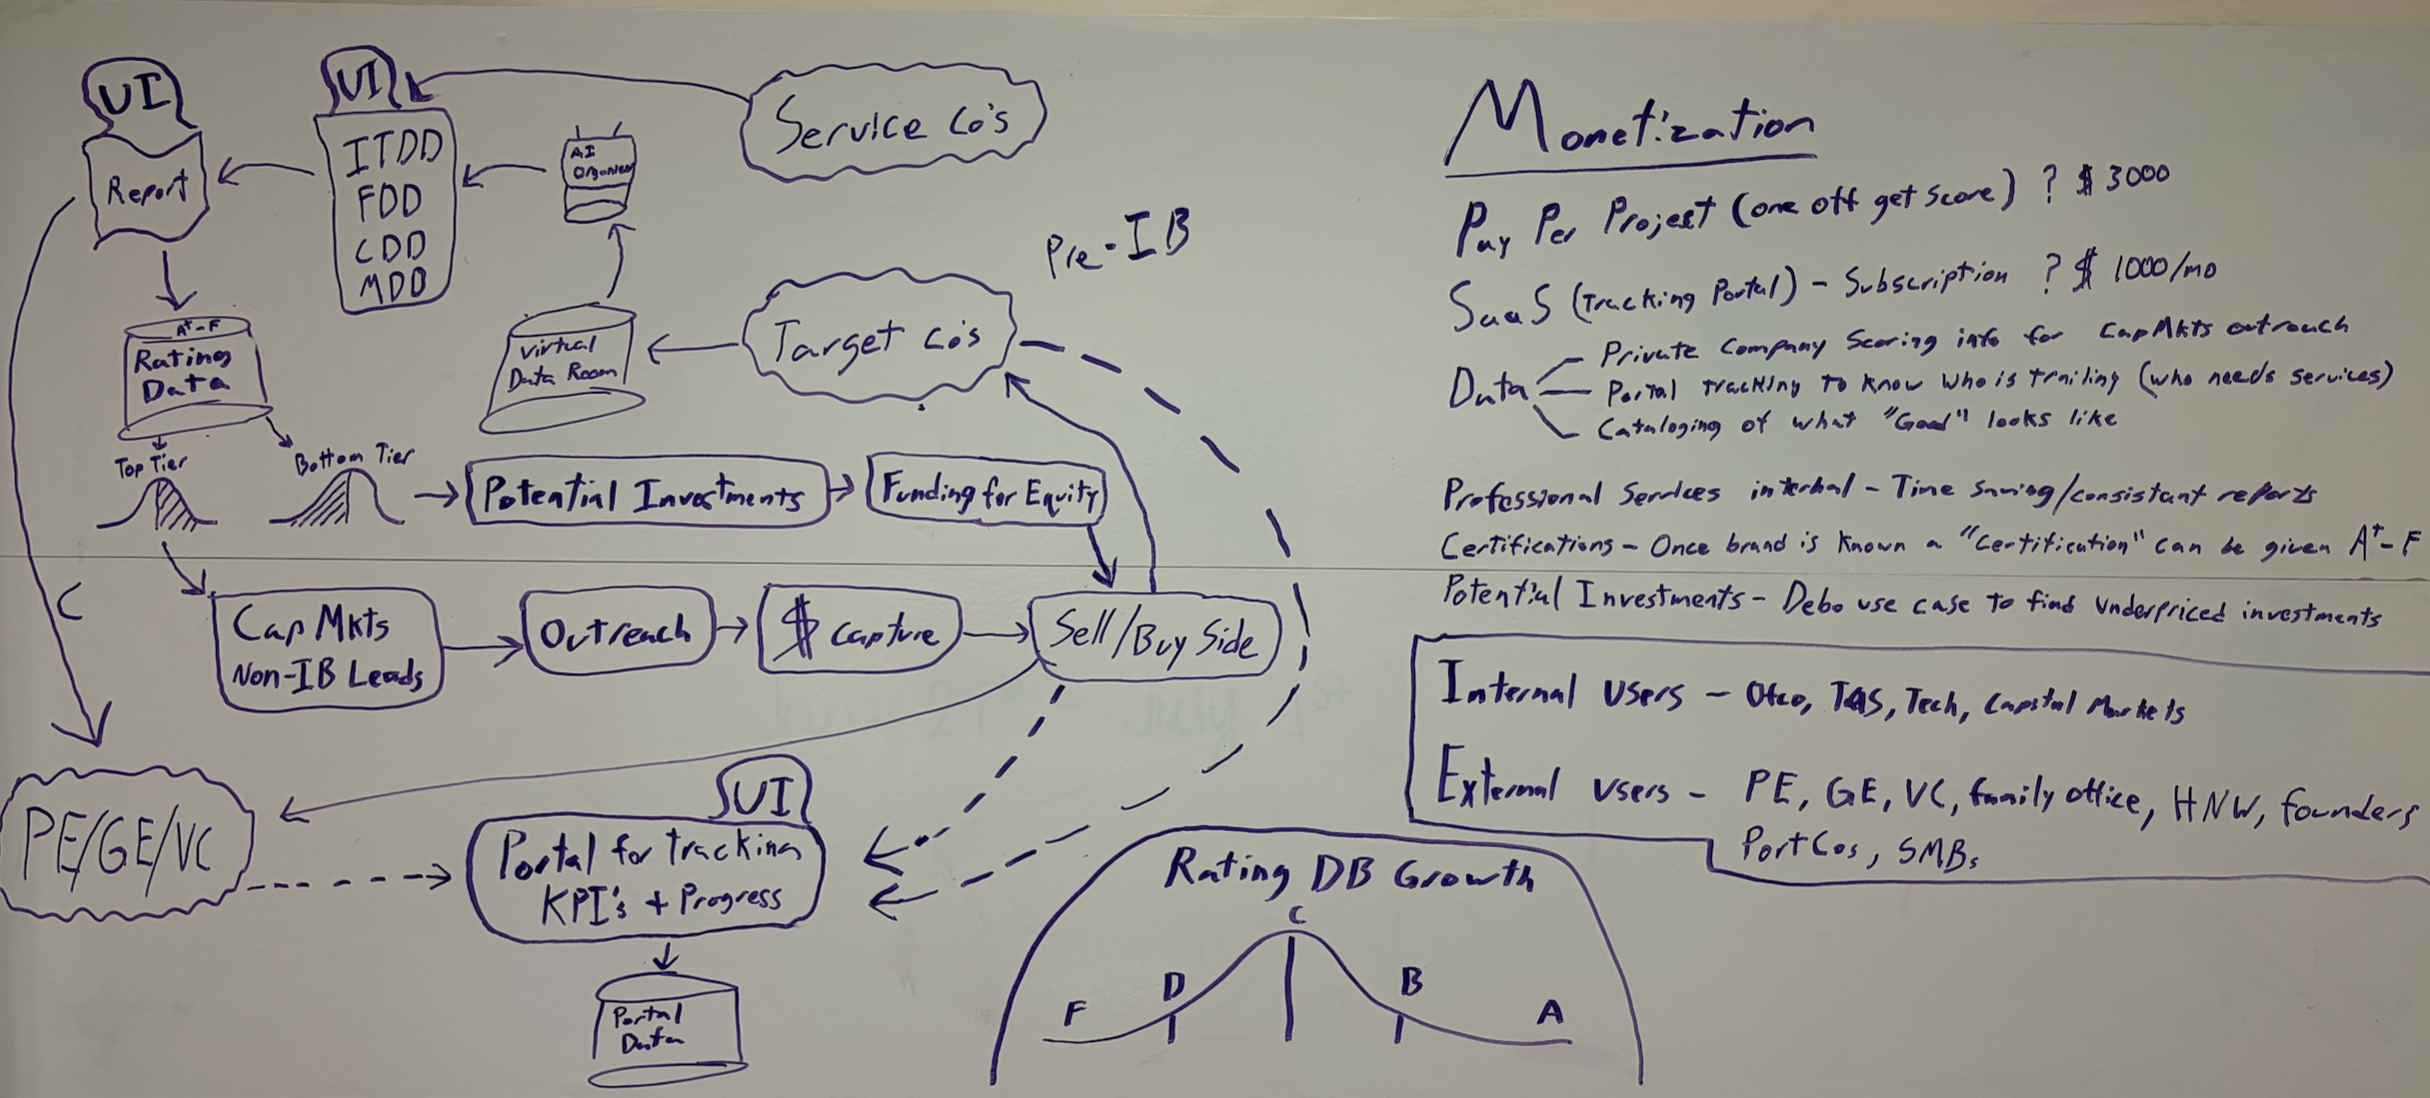
Original Whiteboard Sketch
The hand-drawn flow that started it all — the diagram above is the fully realized version of this concept.
Valeon Partners Integration
How the platform maps to Valeon's existing Deal Lifecycle, Service Lines, and value pillars. Every practice area at Valeon benefits from — and contributes to — the platform.
"This isn't a side project — the platform touches every phase of the deal lifecycle and every practice area at Valeon. Value Protection gets automated QoE. Value Stabilization gets ITDD. Value Creation gets stagnation detection that triggers consulting engagements. Capital markets gets a data-driven deal pipeline. Everyone benefits, everyone contributes back."
Platform × Deal Lifecycle
Valeon's Deal Lifecycle has six phases. The platform participates in every phase, transforming each from a purely human-driven activity into a data-augmented one.
| Platform Capability | Deal Sourcing | Thesis Validation | First 100 Days | Value Creation | Capital Optimization | Exit & Realization |
|---|---|---|---|---|---|---|
| DD Engine (ITDD/FDD) | ● Primary | ● | ||||
| Marketplace | ● Primary | ● | ||||
| KPI Tracking SaaS | ● Primary | ● Primary | ● | ● | ||
| Competitor Scoring | ● | ● | ● | |||
| Cap Markets Alerts | ● Primary | ● Primary | ● | |||
| Services Trigger | ● | ● Primary | ||||
| Equity Intelligence | ● | ● | ● | ● Primary |
Platform × Service Lines (Value Pillars)
Valeon's five value pillars each have specific touch points with the platform. The color coding matches Valeon's branding.
Value Protection
Accounting & Financial Due Diligence (Buy-Side / Sell-Side)
Platform role: Finance Agent automates QoE analysis, GL anomaly detection, working capital assessment, and debt compliance review. Seller Readiness assessments become self-serve DD for pre-exit companies. Complex Integration Advisory benefits from KPI tracking to monitor post-merger financial health.
Revenue impact: FDD Pay-Per-Project revenue, KPI SaaS for post-acquisition financial monitoring.
Value Stabilization
Technology Platform & Product Assessment · Financial Controls · KPI Reporting
Platform role: Technology Agent powers ITDD — the platform's flagship DD type. Financial controls and close process analysis integrates with the Finance Agent. Management/Stakeholder/KPI reporting is exactly what the KPI Tracking SaaS delivers. Investor-grade reporting uses the Report Builder.
Revenue impact: ITDD Pay-Per-Project (highest volume), KPI SaaS subscriptions, Report Builder licensing for future tenants.
Value Creation
Operational Improvement · Pricing Optimization · EBITDA Uplift · Value Bridge
Platform role: Operational improvement targets are identified directly from DD scoring gaps. Pricing and working capital issues surface in the Finance Agent's analysis. The stagnation detector triggers Valeon services when KPI scores plateau — this is the services upsell engine. Value bridge and growth narrative preparation uses the scoring data as evidence.
Revenue impact: Platform-triggered professional services ($400-500/hr), equity positions in improvable companies.
Value Acceleration
AI Readiness · Digital Transformation · Systems Integration
Platform role: The Technology Agent specifically scores AI readiness and digital maturity. Cybersecurity Agent provides standalone security posture assessments. Systems integration roadmaps emerge from architecture analysis. The platform itself demonstrates Valeon's own AI capabilities — a living case study for clients considering digital transformation.
Revenue impact: Technology consulting services triggered by low tech scores, differentiated positioning for Valeon in the market.
Value Formation & Monetization
Capital Formation · Deal Origination · Co-Investment · Recapitalization · Exit Financing
Platform role: This is where the platform becomes a deal origination engine. High-scoring companies feed the capital markets pipeline. Co-investment opportunities emerge from DD data showing undervalued, improvable companies. Recapitalization advisory uses the scoring data to justify terms. Exit financing and capital structure recommendations are data-backed by the KPI trajectory.
Revenue impact: Capital markets success fees (3-5% on $5-15M deals), equity/co-investment returns, finder's fees. This is the highest-value-per-deal revenue stream.
Who at Valeon Benefits — and How
| Valeon Team Member | How the Platform Helps Them | What They Contribute Back |
|---|---|---|
| DD Consultants | AI handles document processing and initial analysis — they focus on expert review, client interaction, and override decisions | Consultant overrides improve AI model accuracy over time |
| Capital Markets / IB Team | Data-driven deal pipeline replaces cold outreach. Warm buyer lists from marketplace intent data. Higher conviction = higher close rate. | Closed deals validate the scoring model and generate brand credibility |
| Value Creation Consultants | Platform identifies exactly which companies need help and what specific improvements will move scores. Pre-qualified warm leads, not cold pitches. | Services engagements produce new KPI data that feeds back into the scoring model |
| Managing Partners | Portfolio-level visibility across all practice areas. Revenue from 8 streams vs. 1 (consulting only). Equity upside on investments. | Strategic decisions on which companies to invest in, which mandates to pursue |
| Business Development | The platform is the pitch — demonstrated AI capabilities, evidence-based approach, marketplace access, KPI dashboards. Every demo sells multiple services. | Referrals and new client relationships feed the engagement pipeline |
Platform Architecture
Six-layer architecture. Valeon-first with multi-tenant licensing built in from day one.
"Six layers, built for multi-tenant from day one. The critical design decision is that this isn't just a Valeon tool — it's architected to license to other advisory firms, which becomes a near-zero-marginal-cost SaaS revenue stream in Year 3+. The AI layer is where the magic happens — six specialized agents running in parallel."
Users
Presentation
API
AI
Data
Infrastructure
Users
PE/VC FirmTarget CompanySelf-Serve CompanyValeon ConsultantCap Markets TeamFuture: Licensed Advisor
Presentation
Marketplace SaaSBackend Advisory PortalClient Report ViewKPI Tracking SaaSVDR Upload PortalMobile-Optimized Views
API
API GatewayOrchestrationEngagement SvcData Request ListReport SvcExport Engine (XLSX/PPTX/PDF)Marketplace SvcKPI SvcCap Markets SvcNotificationsIntegration API (CRM/DealCloud)
AI
Doc ClassifierOCR + PIITech AgentFinance AgentCommercial AgentMarket AgentCompliance AgentCybersecurity AgentRules EngineReport BuilderStagnation DetectorIndustry ClustererLLM GatewayConfidence Scorer
Data
VDR (Encrypted S3)Rating DBEngagement DBKPI Tracking DBVector StoreMarketplace IndexAudit Log
Infrastructure
Auth (Auth0/Cognito)RBAC + Tenant IsolationRedisSQS / Event BusMulti-Model LLM GatewayMonitoringEncryptionSOC 2
Revenue Models
Eight revenue streams, each feeding the next. Six are modeled in the 5-year projections; Equity/Co-Investment and Certifications are strategic upside not included in the base financial model.
"What makes this different from a typical consulting tool is the business model. We don't have one revenue stream — we have eight, and they feed each other. A single DD engagement generates project revenue, creates a marketplace listing, starts KPI tracking, and can trigger a capital markets deal. That compounding is the whole thesis."
1. Pay Per Project
Phase 1
| Tier | Scope | Price | Buyer |
|---|---|---|---|
| Automated | AI-only, no consultant | $3,500–$8,000 | Self-serve companies, lower MM PE |
| AI-Assisted | AI + consultant review | $15K–$40K | Mid-market PE, pre-exit companies |
| Full-Service | AI + deep engagement | $50K–$150K+ | Upper MM PE, complex targets |
2. KPI Tracking SaaS
Phase 2
$500–$5,000/mo per company. PE portfolio monitoring + self-improving companies. Stagnation detector drives services upsell (hybrid: platform drafts proposal, consultant sends).
3. Marketplace Subscriptions
Phase 2
$2K–$5K/mo browse access + $1K–$5K per introduction. Only opt-in companies listed. Evidence-based scores, not self-reported data.
4. Capital Markets & IB
Phase 2-3 — Highest Value
The deal origination engine. 3-5% success fees on $5-15M in annual deal value. Data-driven fundraising mandates, marketplace-sourced deals, sell-side with warm buyer lists, exit timing advisory.
5. Competitor Scoring
Phase 3
$5K–$15K per vertical benchmark report. Proactive clustering activates at 10+ companies per vertical. $1.5K–$3K/mo for live dashboard.
6. Services (Platform-Triggered)
Phase 2
$400–$500/hr. Stagnation detection → recommendation → consultant outreach. Technical improvement, value creation, transaction advisory, financial improvement.
7. Equity / Co-Investment
Phase 3+ — Not in Base Model
1-3 deals/year. Advisory equity, direct investment, co-investment alongside PE clients. $5-15M cumulative portfolio over 5 years. Information advantage from DD data. Excluded from 5-year revenue projections — treated as strategic upside.
8. Certifications
Year 3+ — Not in Base Model
"Valeon Certified" grade. Requires 200+ DDs and brand authority. Scoring taxonomy is certification-grade from day one. Excluded from 5-year revenue projections — treated as strategic upside.
5-Year Revenue Projections
Base model covers 6 quantifiable revenue streams. Equity/Co-Investment and Certifications are strategic upside not included below. Engagement ramp: 20→60→150→300→500.
"These projections are built bottom-up from engagement volume — 20 engagements in Year 1, scaling to 500 by Year 5. The key is that revenue diversifies over time: Year 1 is mostly project fees, but by Year 5 recurring streams (KPI SaaS, marketplace, services) represent two-thirds of revenue. That's the SaaS-like economics emerging from a consulting base."
Revenue by Stream (6 Modeled Streams)
Confidence:
High near-term, committed
Medium credible, requires ramp
Speculative upside if flywheel compounds
| Stream | Y1 H | Y2 H | Y3 M | Y4 M | Y5 S | 5-Yr Total |
|---|---|---|---|---|---|---|
| Pay Per Project | $800K | $1.8M | $3.0M | $5.4M | $7.5M | $18.5M |
| KPI SaaS | $72K | $348K | $1.06M | $2.52M | $5.02M | $9.02M |
| Marketplace | — | $105K | $630K | $1.26M | $2.1M | $4.10M |
| Capital Markets / IB | — | $200K | $840K | $2.0M | $3.84M | $6.88M |
| Competitor Scoring | — | — | $86K | $440K | $1.0M | $1.53M |
| Services | — | $100K | $500K | $1.5M | $3.0M | $5.10M |
| TOTAL | $872K | $2.55M | $6.12M | $13.12M | $22.46M | $45.1M |
Equity/Co-Investment and Certifications are excluded from these projections. If realized, they represent $5-15M+ in additional strategic value.
Revenue Growth
Pay Per Project
KPI SaaS
Marketplace
Capital Markets
Competitor Scoring
Services
Sensitivity Model — Pressure-Test the Assumptions
Adjust the drivers below to see how Y5 revenue, net income, and the data asset respond. All downstream numbers — engagement count, stream-level revenue, total, margin — recompute live.
Key Drivers
Y5 Revenue
$22.5M
base
5-Yr Total
$45.1M
base
Y5 Net Income
$20.9M
base
5-Yr ROI
855%
base
Breakeven Month
7
base
Y5 Companies
1,030
base
Consultant Capacity Savings
Savings apply to AI-Assisted and Full-Service tiers only. The $3.5K automated tier is net-new revenue (no consultant involved), not a capacity play.
| Y1 | Y2 | Y3 | Y4 | Y5 | |
|---|---|---|---|---|---|
| Total Engagements | 20 | 60 | 150 | 300 | 500 |
| Consultant-Involved (est. 80%) | 16 | 48 | 120 | 240 | 400 |
| Hours saved (65 hrs/engagement) | 1,040 | 3,120 | 7,800 | 15,600 | 26,000 |
| Value @ $450/hr | $468K | $1.40M | $3.51M | $7.02M | $11.70M |
| FTEs avoided | 0.5 | 1.6 | 3.9 | 7.8 | 13.0 |
Build Costs & ROI
Lean build: 1 lead data/AI architect + 2 junior developers + AI pair-programming tools for UI assistance. Total 5-year investment: ~$4.7M.
"The build is lean by design — three engineers plus AI pair-programming tools, $484K in Year 1. We're not raising $10M to build a team of 30. We're profitable in Month 7 because engagement revenue covers platform costs from the start. The 855% five-year ROI is real — I've stress-tested every line."
Development Team
| Role | Annual Cost | Responsibility |
|---|---|---|
| Lead Data & AI Architect (1 FTE) | $180,000 | System architecture, RAG pipeline, agent design, LLM Gateway, Rules Engine, data modeling, technical leadership |
| Junior Developer #1 (1 FTE) | $80,000 | Backend API services, database layer, authentication, infrastructure |
| Junior Developer #2 (1 FTE) | $80,000 | Frontend UI development (AI-assisted), component library, integrations |
| AI Pair-Programming Tools | $6,000 | UI generation, code review, testing, documentation — acts as a 4th developer for UI/frontend velocity |
| Total Team Cost | $346,000/yr |
5-Year Cost Summary
| Category | Y1 | Y2 | Y3 | Y4 | Y5 | Total |
|---|---|---|---|---|---|---|
| Dev Team (3 FTE + AI Tools) | $346K | $346K | $380K | $400K | $430K | $1.90M |
| Cloud Infrastructure | $36K | $72K | $120K | $200K | $300K | $728K |
| LLM API Costs | $24K | $60K | $150K | $280K | $420K | $934K |
| Design / UX (contract) | $30K | $15K | $10K | $10K | $10K | $75K |
| Third-Party (Auth0, monitoring, etc.) | $18K | $30K | $48K | $60K | $72K | $228K |
| Sales & Marketing | $30K | $80K | $150K | $250K | $350K | $860K |
| TOTAL COSTS | $484K | $603K | $858K | $1.20M | $1.58M | $4.73M |
Excludes DD consultant costs (included in engagement delivery, offset by engagement revenue).
5-Year P&L
| Y1 | Y2 | Y3 | Y4 | Y5 | Cumulative | |
|---|---|---|---|---|---|---|
| Revenue | $872K | $2.55M | $6.12M | $13.12M | $22.46M | $45.1M |
| Platform Costs | $484K | $603K | $858K | $1.20M | $1.58M | $4.73M |
| Net Operating Income | $388K | $1.95M | $5.26M | $11.92M | $20.88M | $40.4M |
| Operating Margin | 44% | 76% | 86% | 91% | 93% | 90% |
ROI Summary
5-Year Net Income
$40.4M
Revenue minus platform costs
5-Year ROI
855%
$40.4M net / $4.73M invested
Profitable
Month 7
$388K net in first year
5-Year Capacity Saved
$24.1M
53,560 consultant hours freed
Total value created over 5 years: $40.4M net operating income + $24.1M capacity savings + $5-15M equity portfolio (unmodeled) + $15-41M data asset value = $84-120M total value on $4.73M investment.
Key assumption: The 20→500 engagement ramp requires scaling sales and consultant delivery, not just the dev team. At 500 engagements/year (~2 per working day), the platform must handle high throughput with minimal marginal consultant time per automated-tier engagement. Consultant headcount is excluded from platform costs and covered by engagement revenue margins.
Data Asset Valuation
The scored company dataset is a standalone strategic asset — an evidence-based private company intelligence dataset built from actual DD source documents.
"This is the part most people miss on first read. The platform isn't just a tool — it's building the first evidence-based private company intelligence dataset. PitchBook built a $4.5 billion1 business on self-reported data. Our data comes from actual source documents — general ledgers, code repositories, contracts. By Year 5, 1,030 scored companies at $15-40K per record puts the dataset at $15-41M standalone value."
Why This Data Is Differentiated
Evidence-Based
Scores from actual GL, code repos, contracts — not self-reported metrics. Competitors like PitchBook and Crunchbase rely on company-submitted or web-scraped data.
Multi-Dimensional
20+ tracks across tech, finance, commercial, market, compliance, and cybersecurity. No single competitor has this depth across all DD domains.
Longitudinal
KPI tracking creates time-series data — improvement trajectories over years, not point-in-time snapshots.
Defensible (With Caveat)
Can't be web-scraped or API'd — only way to build it is to do the DD engagements. However, competitors like Keye and ToltIQ with 50+ concurrent enterprise clients could accumulate comparable data faster. Speed to scale matters.
Comparable Valuations
| Company | Data Type | Valuation | Records | Value/Record |
|---|---|---|---|---|
| PitchBook | Private market data (self-reported) | ~$4.5B | 3.4M | ~$1,300 |
| Grata | Private company data (aggregated) | ~$200M | 21M | ~$10 |
| Crunchbase | Startup data (community-sourced) | ~$500M | 2M | ~$250 |
| Valeon (Y5) | Evidence-based DD data | $15-41M | 1,030 | $15-40K |
Valeon's per-record value is 10-30x PitchBook's because of dramatically greater depth per company — actual source document analysis vs. self-reported summaries. An acquirer would discount for dataset size (1,030 vs. millions) but pay a premium for evidence quality and exclusivity.
Conservative
$15M
1,030 × $15K/record
Base Case
$26M
1,030 × $25K/record
Upside
$41M
1,030 × $40K/record
Market & Competitive Landscape
"This is a $7B addressable market with no one doing what we're building. Keye, ToltIQ, and Brightwave each automate one piece — the AI analysis. None of them have the post-engagement flywheel: marketplace, KPI tracking, capital markets origination. That full-stack integration is our moat. The risk is speed — they're well-funded and accumulating data. We need to move."
TAM / SAM / SOM
TAM
SAM
SOM (Y5)
TAM
$26B
DD advisory + private data + PE tools
SAM
$7B
Lower/mid MM DD + PE data + portfolio tools
SOM (Y5)
$22.5M
0.32% of SAM — enormous headroom
Competitive Landscape — Three Threat Tiers
Tier 1: Direct AI DD Platforms (Highest Threat)
$8.5M raised · YC-backed
Keye
Built by ex-PE investors. Deterministic financial analysis, auto-generates formatted Excel, "Odin" AI co-pilot. Claiming 100% error-free outputs. Focused on financial DD.
Overlap: Finance Agent, Report Builder, QoE automation
Enterprise clients · SOC 2 Type II
ToltIQ
Serving HarbourVest, Fortress, Investcorp. 56% avg time savings3. Single-tenant architecture, AES-256 encryption. Full VDR upload and query.
Overlap: VDR analysis, document processing, time savings claim
Deep research engine
Brightwave
Processes entire VDRs into sourced IC memos in minutes. 25x faster document processing. Sentence-level attribution. Investment research focus.
Overlap: AI analysis layer, report generation, VDR processing
QoE specialist
Finsider.ai
Purpose-built QoE automation. Connects to accounting systems, auto-detects anomalies, normalizes earnings. 60% faster FDD.
Overlap: Finance Agent QoE, GL anomaly detection
$500/seat · Pre-seed
DealPhlo
AI analyst for PE deal flow at $500/seat/month. Targets lower price point than Valeon's automated tier. Early stage but moving fast.
Overlap: AI DD, lower MM positioning, deal flow
Tier 2: VDR Incumbents Adding AI (Platform Risk)
Market leader · ISO 42001
Datasite
10,000+ deals/yr4. AI classification (90% accuracy), PII redaction (100+ types), gen-AI summarization. First VDR with AI governance cert. Could add scoring on top of existing deal flow.
Bidder scoring · Readiness
Ansarada
Bidder Engagement Score (97% accuracy by day 7). AI readiness scoring, gap detection, checklists. Behavioral intelligence overlaps with marketplace concept.
AI Q&A · European market
Imprima
AI indexing, redaction, auto-generated Q&A answers from VDR docs. Flags duplicate questions. Multi-language translation. ISO 27001 certified.
Tier 3: Adjacent Data & Niche Players
21M+ companies
Grata
Private market intelligence + agentic AI for deal sourcing. Competes for PE eyeballs that marketplace targets.
Predictive signals
DealPotential
7M+ companies, AI signals predicting capital needs 2-8 months out. Competes with Cap Markets Alert feature.
Software DD
YieldDD / Vaultinum
Code-level software DD with CAST tools (YieldDD) and IP verification (Vaultinum). Compete with Technology Agent for ITDD niche.
Risk intelligence
Exiger (DDIQ)
AI due diligence across 300M companies, 6B individuals. Compliance/risk-focused, not financial DD. Adjacent overlap on risk scoring.
Feature Comparison (Expanded)
Has capability
Missing / partial
| Capability | Valeon | Keye | ToltIQ | Brightwave | DealPhlo | Datasite | Big 4 |
|---|---|---|---|---|---|---|---|
| AI-powered DD analysis | ✓ | ✓ | ✓ | ✓ | Partial | Partial | — |
| Multi-DD-type (ITDD + FDD + Compliance + Cyber) | ✓ | FDD only | General | General | — | — | ✓ |
| Configurable scoring taxonomy (0-100) | ✓ | — | — | — | — | — | Manual |
| Anonymized scored marketplace | ✓ | — | — | — | — | — | — |
| KPI tracking / time-series | ✓ | — | — | — | — | — | — |
| Cap markets deal origination | ✓ | — | — | — | Deal flow | — | Separate |
| Industry benchmarks / competitor scoring | ✓ | — | — | — | — | — | — |
| Compounding data moat | ✓ | Growing | Growing | — | Early | ✓ | — |
| Excel/PowerPoint export | ✓ | ✓ | — | — | — | ✓ | |
| CRM/deal tool integrations | Planned | — | — | — | — | ✓ | ✓ |
| Lower MM pricing | From $3.5K | Custom | Custom | Custom | $500/seat | $20K+ | $150K+ |
Valeon's true differentiator: No competitor combines multi-DD-type scoring + anonymized marketplace + KPI tracking + capital markets deal origination in a single platform. Keye, ToltIQ, and Brightwave each overlap on one layer (AI analysis) but none have the post-engagement data compound and monetization flywheel. The risk is that they move faster to accumulate data with their larger enterprise client bases.
Risk Analysis
High Impact
Medium Impact
Low Likelihood
Execution Risks
| Risk | Impact | Likelihood | Mitigation |
|---|---|---|---|
| AI scoring accuracy insufficient for high-stakes DD | High | Medium | Human-in-the-loop from day one. Confidence scores below 85% require mandatory consultant override. Rules Engine is configurable. Start conservative. |
| Engagement volume misses targets (20→500 ramp) | Medium | Medium | Profitable at even moderate volumes. Cap markets deals provide high-value revenue to offset. Y1 only needs 20 engagements. |
| Small team capacity constraints / key-person risk | Medium | Medium | AI pair-programming tools amplify developer output 2-3x. Modular architecture allows phased delivery. Document architecture decisions early to reduce bus factor. |
| 500 engagements/yr needs consultant scaling not modeled | Medium | High | Automated tier ($3.5K) carries no consultant cost. AI-Assisted tiers need consultant capacity planning by Y3. Engagement revenue margins must cover delivery headcount. |
Market Risks
| Risk | Impact | Likelihood | Mitigation |
|---|---|---|---|
| Funded competitors (Keye, ToltIQ, Brightwave) achieve network effects first | High | Medium | Valeon's edge is the full-stack play (DD→marketplace→cap markets). Competitors are point solutions. But speed to scale matters — data moat only works if Valeon gets there first. |
| VDR incumbents (Datasite, Ansarada) add scoring | High | Medium | Incumbents won't cannibalize $150K+ advisory relationships. But Datasite's 10K deals/yr gives them data volume Valeon can't match. Differentiate on depth, not breadth. |
| PE firms distrust AI-generated DD | Medium | Medium | AI-assisted (not AI-only) at higher tiers. Start with existing Valeon relationships. 86%2 of PE leaders already using GenAI in M&A per Deloitte 2025 survey. |
| Data privacy / re-identification of anonymized profiles | High | Low | Per-engagement encryption, PII detection, SOC 2, multi-layer anonymization, opt-in consent. Red-team anonymization before marketplace launch. |
| Regulatory requirements for IB/equity activities | Medium | Medium | Securities counsel before launching. Phase 3+ timing allows proper legal structuring. Broker-dealer / RIA implications must be resolved pre-launch. |
| Economic downturn compresses PE deal volume | Medium | Medium | Automated tier opens the lower MM — a market currently unserved. KPI SaaS and Services provide recurring revenue less correlated to deal volume. |
SWOT Analysis
Strategic assessment of the Valeon Intelligence Platform as a business initiative.
"The honest assessment: our strengths are domain expertise, lean economics, and the full-stack integration no competitor has. The critical weakness is speed to scale — we need to accumulate scored companies faster than funded competitors. The two highest-impact risks are AI accuracy in high-stakes DD and funded competitors achieving network effects first. Our mitigations are real: human-in-the-loop from day one, confidence scoring that forces consultant review below 85%, and a scope advantage (multi-DD-type) that point solutions can't easily replicate. The good news is our existing client relationships eliminate the cold-start problem."
Strengths
- Valeon already has DD domain expertise — the platform augments rather than replaces existing capabilities
- Evidence-based scoring from actual source documents creates a data quality advantage over self-reported datasets
- Eight interlocking revenue streams (6 modeled, 2 strategic upside) with natural upsell paths reduce dependency on any single model
- Lean build team (3 devs + AI tools) keeps costs low — profitable in Month 7 with only 20 Y1 engagements
- Capital markets integration transforms a consulting tool into a deal origination engine worth $5-15M/yr in deal value
- Existing Valeon client relationships provide immediate go-to-market — no cold start problem
- Multi-DD-type coverage (ITDD + FDD + Compliance + Cyber) is a scope advantage no current AI DD competitor matches
- The data asset compounds with every engagement, creating an accelerating moat
Weaknesses
- Early-stage practice — limited engagement history to train AI models and validate scoring accuracy
- Small development team means slower feature velocity and higher key-person risk
- Marketplace and competitor scoring require critical mass of scored companies to be valuable — cold start on data products
- Brand is not yet established in the AI/technology space — need to build credibility as a platform company, not just a consulting firm
- Multi-tenant licensing (future revenue) adds architectural complexity from day one without immediate return
- Aggressive growth model (20→500 engagements) requires sales and consultant scaling not reflected in platform cost model
- $3.5K automated tier competes with well-funded startups (DealPhlo at $500/seat, Keye with $8.5M in funding)
- No established PE tech stack integrations (DealCloud, 4Degrees) — adoption friction for enterprise buyers
Opportunities
- $7B SAM with no competitor combining multi-DD scoring + marketplace + KPI tracking + cap markets origination
- Lower middle market ($10-50M revenue) is underserved by institutional DD — $3.5K automated tier opens a new market
- Private company data gap: 33M US private companies with no standardized quality data — PitchBook proved this market is worth billions
- Capital markets deal flow from platform intelligence — $5-15M annual deal value that competitors can't access
- Licensing the backend to other consulting firms creates a SaaS revenue stream with near-zero marginal cost
- Certifications (Year 3+) could become an industry standard — "Valeon Certified" as the S&P credit rating of private company operations
- AI cost deflation: LLM prices are dropping 50%+ per year, continuously improving platform unit economics
- Compliance & cybersecurity DD are standalone growth markets ($2B+ combined) that the new agents address
- Data ingestion partnerships (accounting firms, law firms, existing VDR providers) could accelerate dataset growth beyond Valeon's own engagements
Threats
- Funded AI DD competitors (Keye $8.5M, ToltIQ enterprise clients, Brightwave) are already serving PE firms and accumulating data faster than Valeon's Y1 ramp of 20 engagements
- VDR incumbents (Datasite: 10K deals/yr, Ansarada: bidder scoring) could add scoring layers on top of massive existing deal flow
- Big 4 or major tech company (Palantir, Bloomberg) enters AI DD — they have brand, capital, and distribution
- PE firms resist AI-generated analysis for high-stakes investment decisions — trust barrier may be higher than anticipated
- Data privacy regulation tightening could constrain marketplace and benchmarking models
- LLM reliability issues (hallucinations, inconsistency) could produce inaccurate scores that damage credibility
- Marketplace re-identification risk — anonymized profiles could be reverse-engineered by market-savvy PE firms
- Regulatory requirements for IB/equity activities (broker-dealer, RIA) could delay or constrain capital markets revenue
- Economic downturn reduces PE deal activity, compressing engagement volume across all tiers
Net Assessment: The strengths and opportunities significantly outweigh the weaknesses and threats. Valeon's unique position is the full-stack play — no competitor combines DD engine + marketplace + KPI tracking + cap markets origination. The primary risk mitigant is the compounding data moat, but speed to scale is critical given well-funded competitors already accumulating data. The lean cost structure means the downside is limited ($4.7M over 5 years), while the upside is asymmetric ($45M revenue, $15-41M data asset, $5-15M equity portfolio). The key strategic question is how fast Valeon can reach critical mass before funded competitors close the scope gap.
Open Questions
Internal Working Document — Not for External Distribution
Decisions for discussion before or during engineering.
"These are the decisions we need to make together before or during build — platform naming, self-serve model depth, legal structure for equity activities, and marketplace pricing mechanics. None of these block MVP, but they shape the Phase 2-3 roadmap. I'd like your input on the top three."
Strategic Decisions
What is the platform called?
"Valeon Intelligence Platform," "Tripyra," or a distinct product brand? Affects marketplace identity, licensing, and certification branding.
How self-serve is the $3.5K automated tier?
True zero-touch (sign up, upload, get report) or does Valeon staff always review? Drives scalability and unit economics. Note: DealPhlo prices at $500/seat — the $3.5K floor needs positioning justification (evidence-based scoring vs. AI-only summary).
What legal structure supports equity/co-investment?
RIA registration? Fund vehicle? Advisory equity through existing firm? Broker-dealer implications for marketplace intro fees? Doesn't block v1 but shapes Phase 3.
Who pays the marketplace introduction fee?
PE firm (buyer), listed company (seller), or both? Affects incentive alignment and pricing model.
KPI re-assessment triggers?
Time-based (monthly), event-driven (new uploads), manual, or combination? Affects SaaS unit economics.
Anonymization depth for marketplace?
Industry + revenue range + geography + tech stack could re-identify. How much context is too much? Red-team testing required before launch.
Product Enhancements to Consider
PE Tech Stack Integrations
DealCloud, 4Degrees, Cobalt LP, and CRM tools PE firms already use. API integrations and data portability are table-stakes for enterprise adoption. Consider building a DealCloud integration before Y2 marketplace launch.
Data Ingestion Partnerships
Accounting firms, law firms, and existing VDR providers could feed anonymized data into the marketplace in exchange for benchmarking access — accelerating dataset growth beyond Valeon's own engagements.
Mobile-Optimized Experience
PE partners review deals on planes and in cars. Mobile-optimized score summaries and report views would be a practical differentiator.
AI Confidence Transparency
Surface AI confidence scores throughout the UX. Gate human review at configurable thresholds (e.g., <85% requires consultant override). Keye emphasizes "100% deterministic" outputs — Valeon needs a trust-building equivalent.
Go-to-Market Channel Strategy
$30K→$350K marketing budget needs channel allocation: ACG/PEI conferences for enterprise, content marketing for self-serve, and a separate GTM motion for the $3.5K automated tier vs. $50K+ full-service tier.
Competitive Moat Timeline
Define milestones: how many scored companies constitute a defensible dataset (100? 500?). Keye and ToltIQ with 50+ concurrent enterprise clients may accumulate faster. Map data accumulation scenarios and identify the crossover point.
Technology Stack — Architecture Decision Record
Recommended technology stack for the Valeon Intelligence Platform. Decisions are optimized for a 3-person team, AI-heavy workloads, rapid iteration, and enterprise-grade security. Total infrastructure cost: $36K (Y1) → $300K (Y5).
"This is the engineering blueprint. Python backend for AI velocity, Next.js frontend, PostgreSQL with row-level security for tenant isolation, all on AWS for SOC 2 compliance. Every choice was made for a three-person team — managed services over self-hosted, modular monolith over microservices at launch. We can extract and scale individual components as volume demands it."
Design Principles: Python-first for AI/ML velocity. TypeScript frontend for type safety across a small team. Managed services over self-hosted to minimize ops burden. AWS for SOC 2 compliance path. Modular monolith initially — extract microservices only when scale demands it.
Stack Overview
Frontend
Next.js
React + TypeScript + Tailwind
Backend
FastAPI
Python 3.12 + async
AI / ML
LangGraph
Claude + GPT-4o + embeddings
Database
PostgreSQL
+ TimescaleDB + pgvector
Cloud
AWS
ECS Fargate + S3 + RDS
Detailed Stack Decisions
| Layer | Technology | Rationale | Alternatives Considered |
|---|---|---|---|
| Frontend Framework | Next.js 14 (App Router) React 18 + TypeScript 5 |
SSR for SEO (marketplace), file-based routing reduces boilerplate, built-in API routes for BFF pattern, excellent AI tooling support for component generation. 5 UI surfaces share a component library. | Remix — less ecosystem support. Vue/Nuxt — smaller hiring pool. SPA-only React — loses SSR benefits for marketplace. |
| UI Components | shadcn/ui + Tailwind CSS Radix primitives |
Copy-paste components (no dependency lock-in), accessible by default, Tailwind enables rapid prototyping with AI assistance. Valeon brand tokens map to Tailwind config. | MUI — heavy, opinionated. Ant Design — enterprise feel but harder to brand. Chakra — good but smaller community than shadcn. |
| Backend Framework | FastAPI (Python 3.12) Pydantic v2, async/await |
Python is the lingua franca for AI/ML — same language for API and AI agents. Auto-generated OpenAPI docs. Pydantic validates all request/response schemas. Async for concurrent document processing. | Django — heavier ORM, less async-native. Node/Express — loses Python AI ecosystem advantage. Go — faster runtime but slower AI development velocity for a 3-person team. |
| AI Orchestration | LangGraph + LangSmith LangChain core for tools |
LangGraph enables stateful, multi-step agent workflows (6 DD agents running in parallel). LangSmith provides observability, tracing, and eval framework. Better control flow than raw LangChain chains. | CrewAI — simpler but less control. AutoGen — Microsoft-aligned, less production-ready. Custom — full control but 3-6 months of framework building. |
| LLM Providers | Anthropic Claude (primary) OpenAI GPT-4o (fallback) + embedding models |
Multi-model gateway with 3 tiers: Fast (Claude Haiku / GPT-4o-mini — classification, OCR). Mid (Claude Sonnet — gap analysis, scoring). Powerful (Claude Opus — report generation, complex analysis). Dual-provider avoids vendor lock-in. | Single provider — vendor risk. Open source (Llama) — self-hosting ops burden too high for 3-person team at launch. Consider for Year 2+ cost optimization. |
| Vector Database | pgvector (PostgreSQL extension) + HNSW indexing |
Co-located with primary database — no additional infrastructure. HNSW indexes handle 1M+ vectors. Simplifies ops for small team. Tenant isolation via PostgreSQL RLS extends to vectors. | Pinecone — managed but adds vendor, cost, and latency. Weaviate — powerful but separate infra. Qdrant — fast but another service to manage. Move to dedicated vector DB if query patterns demand it at scale. |
| Primary Database | PostgreSQL 16 (AWS RDS) + Row-Level Security |
Battle-tested for financial data. RLS enforces multi-tenant isolation at the database level. JSONB for flexible scoring schemas. Excellent tooling ecosystem. RDS handles backups, failover, encryption at rest. | MySQL — no RLS, weaker JSONB. CockroachDB — overkill for Y1 scale. MongoDB — loses relational integrity needed for financial scoring data. |
| Time-Series (KPI) | TimescaleDB PostgreSQL extension |
KPI tracking requires efficient time-series queries (score snapshots over months/years). TimescaleDB runs as a PostgreSQL extension — no additional infrastructure. Hypertables partition by time automatically. | InfluxDB — separate infra. ClickHouse — great for analytics but overkill at Y1 scale. Raw PostgreSQL — works initially but degrades with millions of KPI data points. |
| Search (Marketplace) | Elasticsearch (AWS OpenSearch) Managed service |
Marketplace needs faceted search (industry, score range, geography, revenue band) with sub-second response. Full-text search for report content. OpenSearch is managed — reduces ops burden. | Meilisearch — simpler but less powerful faceting. Algolia — SaaS pricing scales poorly. PostgreSQL FTS — insufficient for marketplace-grade faceted search. |
| Object Storage (VDR) | AWS S3 SSE-KMS, per-engagement keys |
VDR documents encrypted with per-engagement KMS keys (AES-256). S3 provides versioning, lifecycle policies, and audit logging. Pre-signed URLs for secure upload/download without backend proxying. | GCS — comparable but Valeon is AWS-first. MinIO — self-hosted, more ops burden. |
| Cache | Redis (AWS ElastiCache) Session store + rate limiting |
Session management, API rate limiting, LLM response caching, real-time notification pub/sub. Managed ElastiCache handles failover. | Memcached — no pub/sub, no persistence. Valkey — Redis fork, less managed support currently. |
| Message Queue | AWS SQS + EventBridge FIFO queues for ordering |
SQS for async document processing pipeline (upload → OCR → classify → chunk → embed → analyze). EventBridge for cross-service events (engagement created, report finalized, score updated). Managed = zero ops. | RabbitMQ — self-hosted ops. Kafka — overkill for Y1 throughput. Consider Kafka at 300+ engagements/year if event replay becomes important. |
| Authentication | Auth0 RBAC + Organizations |
Multi-tenant auth with Organizations (PE firms, target companies, Valeon staff). RBAC roles: admin, consultant, client-viewer, company-uploader, marketplace-subscriber. SSO/SAML for enterprise PE firms. SOC 2 compliant. | Cognito — cheaper but weaker multi-tenant support. Clerk — developer-friendly but less enterprise. Custom — security liability for a 3-person team. |
| Compute | AWS ECS Fargate Containerized, serverless |
No server management. Auto-scales with engagement volume. Task-level isolation for document processing. Cost-efficient at Y1 scale (~$500/mo), scales linearly. | EKS — Kubernetes overhead too high for 3-person team. Lambda — cold starts problematic for LLM orchestration. EC2 — server management burden. Consider EKS migration at Y3+ if service count exceeds 10. |
| CI/CD | GitHub Actions + Terraform for IaC |
Team is already on GitHub. Actions handles build, test, deploy. Terraform manages all AWS infrastructure as code — critical for SOC 2 audit trail. Environment promotion: dev → staging → prod. | GitLab CI — requires migration. CircleCI — additional vendor. AWS CodePipeline — less flexible, more AWS lock-in. |
| Monitoring | Datadog APM + Logs + Dashboards |
Unified APM, logging, dashboards, and alerting. LLM observability (token usage, latency per model). SOC 2 requires centralized logging. Expensive but worth it for a 3-person team that can't build custom monitoring. | CloudWatch — cheaper but weak APM. Grafana Cloud — good but requires more config. New Relic — comparable, slightly less AI-native. |
| Document Processing | AWS Textract + unstructured.io OCR + document parsing |
Textract handles PDF/image OCR with table extraction. unstructured.io parses diverse formats (DOCX, XLSX, email, code) into clean text for embedding. Combined pipeline covers the full VDR document spectrum. | Azure Form Recognizer — cross-cloud complexity. Tesseract — lower accuracy on financial documents. LlamaParse — good but newer, less battle-tested. |
Cost Projection by Infrastructure Component
| Component | Y1 (20 eng) | Y2 (60 eng) | Y3 (150 eng) | Y5 (500 eng) | Notes |
|---|---|---|---|---|---|
| ECS Fargate | $6K | $14K | $30K | $80K | Scales with engagement concurrency |
| RDS PostgreSQL | $4K | $8K | $15K | $36K | Multi-AZ from Y2 |
| S3 (VDR storage) | $2K | $6K | $12K | $30K | ~500MB per engagement avg |
| OpenSearch | $3K | $6K | $10K | $24K | Marketplace search cluster |
| ElastiCache Redis | $2K | $4K | $6K | $12K | Single node → cluster at Y3 |
| KMS (encryption keys) | $1K | $2K | $4K | $8K | Per-engagement keys |
| Auth0 | $6K | $12K | $20K | $30K | Enterprise plan from Y2 |
| Datadog | $6K | $10K | $15K | $24K | APM + Logs + Infra |
| Textract | $2K | $4K | $8K | $16K | $1.50/page avg |
| Networking / DNS / CDN | $2K | $3K | $5K | $10K | CloudFront, Route53, NAT |
| CI/CD / GitHub | $2K | $3K | $5K | $8K | Actions minutes + seats |
| TOTAL INFRA | $36K | $72K | $130K | $278K | Aligns with cost model ±10% |
Key Decision: Modular Monolith First. Start with a single FastAPI application with well-defined internal modules (engagement, document_processing, agents, reporting, marketplace, kpi). Extract into microservices only when a module needs independent scaling — likely document processing (Y2) and the LLM gateway (Y2-Y3). This keeps the 3-person team productive instead of managing 10+ services from day one.
Migration Path: The stack is designed with clear extraction boundaries. PostgreSQL RLS → dedicated tenant databases if a client demands it. pgvector → Pinecone if vector queries become a bottleneck. ECS Fargate → EKS if service count exceeds 10. SQS → Kafka if event replay/sourcing becomes critical. Each migration can happen independently without rebuilding the platform.
Technical Specification
Database schemas, API contracts, service architecture, and infrastructure design. This specification is sufficient to begin Sprint 1 development or serve as the technical section of a development RFP.
"This tab is for the engineering team — database schemas, API contracts, processing pipelines. The key message for non-technical readers: this is specific enough to begin Sprint 1 development or hand to a dev agency as an RFP. We're not in the 'idea' phase — we know exactly what to build."
Core Data Model
PostgreSQL with Row-Level Security (RLS) for multi-tenant isolation. All tables include tenant_id for RLS enforcement. UUIDs for all primary keys. Timestamps in UTC.
Tenants & Auth
| Table | Column | Type | Constraints | Notes |
|---|---|---|---|---|
| tenants | id | UUID | PK | |
| name | VARCHAR(255) | NOT NULL | Organization name | |
| type | ENUM | NOT NULL | valeon | pe_firm | company | advisor | |
| auth0_org_id | VARCHAR(64) | UNIQUE | Auth0 Organization reference | |
| settings | JSONB | Tenant-specific config | ||
| users | id | UUID | PK | |
| tenant_id | UUID | FK → tenants | RLS filter column | |
| auth0_user_id | VARCHAR(64) | UNIQUE | ||
| VARCHAR(255) | NOT NULL | |||
| role | ENUM | NOT NULL | admin | consultant | client_viewer | uploader | subscriber | |
| last_login_at | TIMESTAMPTZ |
Engagements & Documents
| Table | Column | Type | Constraints | Notes |
|---|---|---|---|---|
| engagements | id | UUID | PK | |
| tenant_id | UUID | FK → tenants, RLS | ||
| client_tenant_id | UUID | FK → tenants | PE firm commissioning DD | |
| target_tenant_id | UUID | FK → tenants | Company being assessed | |
| dd_type | ENUM | NOT NULL | itdd | fdd | compliance | cyber | combined | |
| pricing_tier | ENUM | NOT NULL | automated | ai_assisted | full_service | |
| status | ENUM | NOT NULL | setup | intake | analysis | review | delivered | closed | |
| marketplace_consent | BOOLEAN | DEFAULT false | Opt-in for anonymized listing | |
| kpi_consent | BOOLEAN | DEFAULT false | Opt-in for ongoing tracking | |
| kms_key_arn | VARCHAR(255) | NOT NULL | Per-engagement S3 encryption key | |
| documents | id | UUID | PK | |
| engagement_id | UUID | FK → engagements | ||
| s3_key | VARCHAR(512) | NOT NULL | Encrypted S3 path | |
| original_filename | VARCHAR(255) | NOT NULL | ||
| file_type | VARCHAR(20) | NOT NULL | pdf, xlsx, docx, code, etc. | |
| size_bytes | BIGINT | NOT NULL | ||
| classification | VARCHAR(50) | AI-assigned DD track category | ||
| classification_confidence | DECIMAL(5,4) | 0.0000 – 1.0000 | ||
| pii_detected | BOOLEAN | DEFAULT false |
Scoring & Ratings
| Table | Column | Type | Constraints | Notes |
|---|---|---|---|---|
| scores | id | UUID | PK | Immutable — new row per score event |
| engagement_id | UUID | FK → engagements | ||
| agent_type | ENUM | NOT NULL | technology | finance | commercial | market | compliance | cyber | |
| track | VARCHAR(50) | NOT NULL | e.g., architecture, sdlc, qoe, working_capital | |
| score | SMALLINT | CHECK 0-100 | Normalized score | |
| ai_confidence | DECIMAL(5,4) | NOT NULL | <0.85 → requires consultant override | |
| consultant_override | SMALLINT | CHECK 0-100, NULL | NULL = AI score accepted | |
| override_reason | TEXT | |||
| scored_at | TIMESTAMPTZ | NOT NULL | Immutable timestamp | |
| kpi_snapshots (TimescaleDB hypertable) | id | UUID | PK | |
| company_id | UUID | FK → tenants | ||
| track | VARCHAR(50) | NOT NULL | ||
| score | SMALLINT | CHECK 0-100 | ||
| snapshot_at | TIMESTAMPTZ | NOT NULL | Hypertable partition key | |
| metadata | JSONB | Supporting data for trend analysis |
Reports & Marketplace
| Table | Column | Type | Constraints | Notes |
|---|---|---|---|---|
| reports | id | UUID | PK | |
| engagement_id | UUID | FK → engagements | ||
| version | INT | NOT NULL | Auto-incrementing per engagement | |
| status | ENUM | NOT NULL | draft | review | approved | delivered | |
| content | JSONB | NOT NULL | Structured report content (sections, findings, scores) | |
| generated_by | ENUM | NOT NULL | ai | consultant | hybrid | |
| pdf_s3_key | VARCHAR(512) | Exported PDF path | ||
| marketplace_listings | id | UUID | PK | |
| engagement_id | UUID | FK → engagements | Source engagement | |
| anonymized_profile | JSONB | NOT NULL | Industry, revenue range, geo, scores — no PII | |
| composite_score | SMALLINT | CHECK 0-100 | Weighted aggregate | |
| industry_vertical | VARCHAR(100) | NOT NULL | For clustering and filtering | |
| revenue_band | VARCHAR(20) | NOT NULL | e.g., $10M-$25M | |
| is_active | BOOLEAN | DEFAULT true | ||
| consent_revoked_at | TIMESTAMPTZ | NULL = active consent |
API Contract — Core Endpoints
RESTful API with versioned paths (/api/v1/). All endpoints require JWT Bearer token. Pagination via cursor-based pagination. Rate limited: 100 req/min (standard), 1000 req/min (internal).
Engagement Lifecycle
| Method | Endpoint | Description | Auth Role |
|---|---|---|---|
| POST | /api/v1/engagements | Create new engagement (scope, DD type, pricing tier, consents) | consultant, admin |
| GET | /api/v1/engagements | List engagements (filterable by status, type, client) | consultant, admin, client_viewer |
| GET | /api/v1/engagements/{id} | Get engagement detail with current scores and status | consultant, admin, client_viewer |
| PUT | /api/v1/engagements/{id}/status | Transition engagement status (validates state machine) | consultant, admin |
| POST | /api/v1/engagements/{id}/vdr-link | Generate pre-signed VDR upload URL for target company | consultant, admin |
| POST | /api/v1/engagements/{id}/invite | Send secure invitation email to target company | consultant, admin |
Document Processing
| Method | Endpoint | Description | Auth Role |
|---|---|---|---|
| POST | /api/v1/engagements/{id}/documents | Upload document → triggers async processing pipeline | uploader, consultant |
| GET | /api/v1/engagements/{id}/documents | List documents with classification status and PII flags | consultant, admin |
| GET | /api/v1/engagements/{id}/gap-analysis | Get missing document categories for this DD type | consultant, admin |
| POST | /api/v1/engagements/{id}/data-request-list | Generate and send follow-up data request to target | consultant, admin |
AI Analysis & Scoring
| Method | Endpoint | Description | Auth Role |
|---|---|---|---|
| POST | /api/v1/engagements/{id}/analyze | Trigger parallel AI agent analysis (async — returns job ID) | consultant, admin |
| GET | /api/v1/engagements/{id}/scores | Get all scores (AI + overrides) for an engagement | consultant, admin, client_viewer |
| PUT | /api/v1/scores/{id}/override | Consultant override of an AI score (with reason) | consultant, admin |
| GET | /api/v1/engagements/{id}/confidence | Get AI confidence breakdown — flags <85% for review | consultant, admin |
Reports & Export
| Method | Endpoint | Description | Auth Role |
|---|---|---|---|
| POST | /api/v1/engagements/{id}/reports | Generate AI-drafted report (async) | consultant, admin |
| GET | /api/v1/reports/{id} | Get report content with version history | consultant, admin, client_viewer |
| PUT | /api/v1/reports/{id} | Update report content (consultant edits) | consultant, admin |
| POST | /api/v1/reports/{id}/export | Export report as PDF / XLSX / PPTX | consultant, admin, client_viewer |
| PUT | /api/v1/reports/{id}/deliver | Mark report as delivered to client | consultant, admin |
Marketplace & KPI
| Method | Endpoint | Description | Auth Role |
|---|---|---|---|
| GET | /api/v1/marketplace/listings | Search/filter anonymized company profiles | subscriber |
| POST | /api/v1/marketplace/introductions | Request introduction to a listed company | subscriber |
| GET | /api/v1/kpi/{company_id}/scores | Get KPI time-series for a company | client_viewer, consultant |
| GET | /api/v1/kpi/{company_id}/stagnation | Get stagnation detection alerts | consultant, admin |
| GET | /api/v1/benchmarks/{vertical} | Get industry benchmark scores | consultant, admin, subscriber |
Document Processing Pipeline
Upload via Pre-signed URL
→
S3 Event Trigger
→
SQS: doc-processing
→
Textract OCR
→
PII Detector (regex + LLM)
Doc Classifier (Haiku)
→
Chunk + Embed (text-embedding-3-large)
→
pgvector Store
→
Gap Analysis Check
→
EventBridge: doc.processed
Average processing time: 30-90 seconds per document. Pipeline is idempotent — re-uploads overwrite previous versions. Each step publishes status to WebSocket for real-time progress UI.
AI Agent Architecture
Orchestrator Service
→
Fan-out: 6 SQS queues
→
Parallel Agent Execution
Technology Agent
RAG → Sonnet → Score
RAG → Sonnet → Score
Finance Agent
RAG → Sonnet → Score
RAG → Sonnet → Score
Commercial Agent
RAG → Sonnet → Score
RAG → Sonnet → Score
Market Agent
RAG → Sonnet → Score
RAG → Sonnet → Score
Compliance Agent
RAG → Sonnet → Score
RAG → Sonnet → Score
Cybersecurity Agent
RAG → Sonnet → Score
RAG → Sonnet → Score
Rules Engine (score normalization)
→
Confidence Scorer
→
Rating DB (immutable insert)
→
EventBridge: analysis.complete
Each agent follows the same pattern: (1) Retrieve relevant document chunks via RAG, (2) Apply rules engine scoring taxonomy, (3) Generate structured scores + narrative findings via LLM, (4) Return confidence score. LLM Gateway routes to appropriate model tier based on task complexity.
Security Architecture
| Layer | Control | Implementation |
|---|---|---|
| Authentication | JWT + RBAC | Auth0 issues JWTs with role claims. API Gateway validates on every request. Refresh token rotation enforced. |
| Authorization | Row-Level Security | PostgreSQL RLS policies filter all queries by tenant_id. No application-level filtering needed — defense in depth. |
| Encryption at Rest | AES-256, per-engagement keys | VDR documents encrypted with AWS KMS customer-managed keys. One key per engagement. Database encrypted via RDS. |
| Encryption in Transit | TLS 1.3 | All external connections require TLS. Internal VPC traffic via TLS with service mesh (future). |
| PII Protection | Detect + redact pipeline | Regex patterns + LLM fallback detect PII in uploaded documents. PII flagged, logged, and redactable before analysis. |
| Audit Trail | Immutable event log | All state changes (score, override, report version, export, access) logged with actor, timestamp, and before/after. |
| SOC 2 Readiness | Type I target: Month 9 | Terraform IaC + audit logs + RBAC + encryption + access reviews. Type I achievable with managed services stack. |
Product Backlog — Phased Roadmap
Three development phases over 18 months. MVP in 4 months, V1 at 9 months, V2 at 18 months. Estimated at 450 total story points across 25 epics. Sprint velocity assumption: 30 pts/sprint (2-week sprints, 3-person team).
"77 user stories, 15 epics, three phases. MVP in 4 months — a real ITDD engagement running end-to-end with AI. V1 at 9 months with all agents and the marketplace live. V2 at 18 months with capital markets and integrations. Every story has acceptance criteria and point estimates. This is ready to hand to a team."
MVP Launch
Month 4
Core DD engine + VDR + 1 agent
V1 Launch
Month 9
All agents + marketplace + KPI
V2 Launch
Month 18
Cap markets + integrations + mobile
Total Effort
~450 pts
15 sprints MVP · 10 V1 · 18 V2
MVP — Months 1-4 Core DD Engine
Goal: Run a single ITDD engagement end-to-end with AI assistance. Validate the core value proposition with 3-5 real engagements before expanding.
Epic 1: Authentication & Tenant Foundation 34 pts · Sprint 1-2
US-001 As a Valeon admin, I can create a new tenant (PE firm or target company) so that users are isolated by organization. 5
US-002 As a user, I can log in via Auth0 SSO and be routed to my tenant's dashboard so that I see only my organization's data. 5
US-003 As a platform, Row-Level Security policies are enforced on all database tables so that tenants cannot access each other's data. 8
US-004 As a consultant, I can see an engagement list filtered by my role and tenant so that I only manage my assigned work. 3
US-005 As an admin, I can assign roles (consultant, client_viewer, uploader) to users within a tenant. 5
US-006 As a platform, all API endpoints validate JWT tokens and enforce role-based access control. 8
Epic 2: Engagement Lifecycle 26 pts · Sprint 2-3
US-007 As a consultant, I can create an engagement with DD type, pricing tier, client, and target company so that the workflow is initialized. 5
US-008 As a consultant, I can capture marketplace and KPI consent flags at engagement creation. 2
US-009 As a consultant, I can generate a secure VDR upload link with a per-engagement KMS encryption key. 8
US-010 As a consultant, I can send a branded invitation email to the target company with the VDR upload link. 3
US-011 As a consultant, I can transition engagement status (setup → intake → analysis → review → delivered → closed) with validation. 5
US-012 As a consultant, I can view an engagement dashboard showing status, document count, score summary, and timeline. 3
Epic 3: Document Intake & VDR 40 pts · Sprint 3-5
US-013 As a target company user, I can upload documents via a drag-and-drop VDR interface with real-time upload progress. 5
US-014 As a platform, uploaded documents are encrypted with the engagement's KMS key and stored in S3 with audit logging. 5
US-015 As a platform, documents are automatically processed through the OCR pipeline (Textract) upon upload. 8
US-016 As a platform, PII is detected in uploaded documents using regex patterns with LLM fallback, and flagged for review. 5
US-017 As a platform, documents are classified by DD track category (financial, technology, legal, etc.) using an LLM classifier. 5
US-018 As a platform, document text is chunked and embedded into pgvector for RAG retrieval. 5
US-019 As a consultant, I can view a gap analysis showing which document categories are missing for this DD type. 3
US-020 As a consultant, I can generate and send a data request list to the target company for missing documents. 2
US-021 As a consultant, I can view real-time processing status for each document (uploaded → OCR → classified → embedded). 2
Epic 4: Technology Agent (ITDD) 34 pts · Sprint 5-7
US-022 As a platform, the Technology Agent analyzes embedded documents via RAG and scores 5 tracks: Architecture, Infrastructure, SDLC, Security, DevOps. 13
US-023 As a platform, the Rules Engine normalizes raw agent output into 0-100 scores using configurable taxonomy weights. 8
US-024 As a platform, each score includes an AI confidence value; scores with confidence <85% are flagged for mandatory consultant review. 3
US-025 As a consultant, I can view AI-generated scores with supporting evidence (source document excerpts) and override any score with a reason. 5
US-026 As a platform, all scores (AI and overrides) are stored as immutable rows in the Rating DB with timestamps. 2
US-027 As a platform, the LLM Gateway routes to Haiku (classification), Sonnet (analysis), or Opus (report generation) based on task type. 3
Epic 5: Report Builder & Client Portal (MVP) 30 pts · Sprint 6-8
US-028 As a consultant, I can trigger AI report generation that produces a structured ITDD report with executive summary, track scores, findings, and risk matrix. 8
US-029 As a consultant, I can edit the AI-drafted report (narrative sections, findings, recommendations) before delivery. 5
US-030 As a consultant, I can approve and deliver the report, making it visible in the client portal. 3
US-031 As a PE client, I can view the delivered report in an interactive web portal with scored tracks, drill-down findings, and risk matrix. 8
US-032 As a PE client, I can export the report as a PDF from the client portal. 3
US-033 As a platform, report versions are tracked so consultants can view change history. 3
MVP Definition of Done: A Valeon consultant can create an engagement, send a VDR link, receive uploaded documents, trigger AI-powered ITDD analysis (Technology Agent), review and override scores, generate a client report, and deliver it via an interactive portal. Total: ~164 points, 8 sprints (16 weeks).
V1 — Months 5-9 Full DD Suite & Data Products
Goal: Expand to all DD types, launch marketplace and KPI tracking. Begin collecting the compounding data asset. Target: first marketplace subscribers and KPI SaaS contracts.
Epic 6: Remaining AI Agents (Finance, Commercial, Market, Compliance, Cyber) 40 pts · Sprint 9-12
US-034 As a platform, the Finance Agent scores QoE, Revenue Quality, Cost Structure, Working Capital, and Debt Compliance tracks. 8
US-035 As a platform, the Commercial Agent scores Customer Concentration, Sales Pipeline, Pricing Power, and Retention tracks. 8
US-036 As a platform, the Market Agent scores TAM, Competitive Position, Barriers to Entry, and Growth Trajectory tracks. 8
US-037 As a platform, the Compliance Agent scores ESG, GDPR/Privacy, SOX, and Regulatory Exposure tracks. 8
US-038 As a platform, the Cybersecurity Agent scores Vulnerability Posture, Incident History, Data Protection, and Access Controls tracks. 8
Epic 7: Marketplace & Anonymization 34 pts · Sprint 11-14
US-039 As a platform, when an engagement closes with marketplace consent, an anonymized profile is generated and indexed in OpenSearch. 8
US-040 As a marketplace subscriber, I can search and filter company profiles by industry, score range, revenue band, and geography. 5
US-041 As a subscriber, I can request an introduction to a listed company, triggering a Valeon-mediated process. 5
US-042 As a company, I can revoke marketplace consent at any time, deactivating my listing. 3
US-043 As a platform, anonymization is validated via red-team checks (k-anonymity ≥ 5) before publishing. 8
US-044 As an admin, I can manage marketplace subscription billing (Stripe integration). 5
Epic 8: KPI Tracking SaaS 30 pts · Sprint 12-15
US-045 As a company with KPI consent, my DD scores become the baseline for ongoing time-series tracking in TimescaleDB. 5
US-046 As a company, I can view a KPI dashboard showing score trajectories over time with trend indicators. 8
US-047 As a platform, the Stagnation Detector identifies plateau patterns and triggers improvement recommendations. 8
US-048 As a PE firm, I can view a portfolio-level KPI dashboard across all my tracked companies. 5
US-049 As an admin, I can manage KPI subscription billing with tiered pricing ($500-$5K/mo). 4
Epic 9: Export Engine & Enhanced Reports 21 pts · Sprint 13-14
US-050 As a client, I can export reports as formatted Excel workbooks with score data, findings, and appendices. 5
US-051 As a client, I can export reports as PowerPoint presentations with executive summary slides and score visualizations. 8
US-052 As a platform, the FDD report template includes QoE bridge, income statement, balance sheet, and GL anomaly details. 5
US-053 As a client, I can use a Q&A feature in the report portal to ask follow-up questions answered via RAG. 3
V1 Definition of Done: All 6 AI agents operational. Marketplace live with anonymized profiles and subscriber search. KPI tracking active for consented companies. Export engine delivers Excel and PowerPoint. Total additional: ~125 points, 7 sprints (14 weeks).
V2 — Months 10-18 Scale & Monetization
Goal: Capital markets pipeline, competitor scoring, PE tech stack integrations, mobile experience. Platform shifts from internal tool to scalable product.
Epic 10: Capital Markets Pipeline 26 pts · Sprint 16-18
US-054 As a platform, companies scoring above a configurable threshold are flagged as capital markets candidates with deal suitability scores. 5
US-055 As a cap markets team member, I can view a deal pipeline dashboard with ranked candidates and buyer intent signals from marketplace. 8
US-056 As a platform, marketplace introduction requests generate warm buyer lists for sell-side mandates. 5
US-057 As a cap markets team member, I can generate a data-backed investment memo from the company's DD scores and KPI trajectory. 8
Epic 11: Competitor Scoring & Benchmarks 21 pts · Sprint 17-19
US-058 As a platform, the Industry Clusterer groups scored companies by vertical when 10+ exist in a segment. 5
US-059 As a subscriber, I can purchase a competitor benchmark report comparing anonymized companies within a vertical. 8
US-060 As a subscriber, I can access a live benchmark dashboard showing industry score distributions (updated as new DDs complete). 5
US-061 As a platform, proactive competitor scoring reports are generated and offered to marketplace subscribers in relevant verticals. 3
Epic 12: PE Tech Stack Integrations 26 pts · Sprint 18-21
US-062 As a PE firm using DealCloud, engagement data and scores sync bi-directionally via the Integration API. 8
US-063 As a PE firm using 4Degrees, deal contacts and relationship data are accessible within the Valeon platform. 8
US-064 As a PE firm, I can export any engagement data via a documented REST API with webhook support. 5
US-065 As an admin, I can configure integration credentials and sync settings per tenant via a settings UI. 5
Epic 13: Mobile Experience 18 pts · Sprint 20-22
US-066 As a PE partner on mobile, I can view engagement score summaries and risk highlights in a responsive layout. 5
US-067 As a PE partner on mobile, I can browse the marketplace, view profiles, and request introductions. 5
US-068 As a client on mobile, I can view my KPI dashboard with score trends and stagnation alerts. 5
US-069 As a platform, push notifications alert users to completed reports, score changes, and stagnation events. 3
Epic 14: Automated Tier (Self-Serve) 21 pts · Sprint 21-23
US-070 As a self-serve company, I can sign up, select a DD type, and pay $3.5K-$8K via Stripe without Valeon staff involvement. 8
US-071 As a self-serve company, I receive an automated report within 48 hours of document upload completion. 5
US-072 As a platform, automated-tier reports include a prominent disclosure that no consultant review was performed, with an upsell path to AI-Assisted tier. 3
US-073 As a platform, automated-tier engagement data feeds into the same data asset (marketplace, KPI, benchmarks) with appropriate consent. 5
Epic 15: SOC 2 & Compliance 18 pts · Sprint 22-24
US-074 As a platform, all infrastructure is managed via Terraform with state in S3, providing an auditable change history. 5
US-075 As an auditor, I can access centralized logs (Datadog) showing all data access, authentication events, and system changes. 5
US-076 As a platform, quarterly access reviews are automated — stale accounts flagged, excessive permissions reported. 5
US-077 As a platform, all SOC 2 Type I control evidence is documented and ready for auditor review by Month 12. 3
V2 Definition of Done: Capital markets pipeline operational. Competitor scoring and benchmarks available. DealCloud and 4Degrees integrations live. Mobile-responsive experience for PE partners. Self-serve $3.5K automated tier accepting sign-ups. SOC 2 Type I achieved. Total additional: ~150 points, 9 sprints (18 weeks).
Sprint Allocation Summary
| Phase | Sprints | Duration | Story Points | Key Deliverables |
|---|---|---|---|---|
| MVP | 1-8 | Months 1-4 | ~164 pts | Auth, Engagement lifecycle, VDR, Tech Agent, Report Builder, Client Portal |
| V1 | 9-15 | Months 5-9 | ~125 pts | 5 remaining agents, Marketplace, KPI SaaS, Export Engine |
| V2 | 16-27 | Months 10-18 | ~150 pts | Cap Markets, Competitor Scoring, Integrations, Mobile, Self-Serve, SOC 2 |
| TOTAL | 27 | ~14 months | ~439 pts | Full platform operational |
Buffer: 4 months of contingency built into the 18-month timeline. Velocity may improve as team becomes proficient with the stack and AI pair-programming tools. Scope can be trimmed by deferring Epics 12-13 (integrations, mobile) if capacity is tight.
Investor Business Plan
1. The Problem
- •Due diligence is manual, inconsistent, and dependent on whoever does the work — 88+ hours per engagement with no standardized evaluation framework.
- •No one is building an evidence-based dataset of private company technology health from actual source documents.
- •Consulting engagements generate a single fee and zero compounding value — every project starts from scratch.
2. The Solution
- •A 21,224-node Knowledge Graph that makes AI-powered due diligence deterministic, auditable, and repeatable in 23 hours instead of 88.
- •A platform that converts each engagement into eight revenue streams — project fees, KPI monitoring, marketplace, capital markets, benchmarking, services, certification, and co-investment.
- •A tiered model ($3.5K to $150K) that scales from Valeon's existing clients to a licensable multi-tenant SaaS platform with 90%+ margins.
3. Why It Matters
- •Transforms Valeon from a labor-constrained practice into a platform business — $872K Year 1 to $22.5M Year 5, 93% margins, 855% five-year ROI.
- •Creates a proprietary data asset ($15–41M by Year 5) that improves every Leon Capital acquisition, portfolio monitoring decision, and deal origination.
- •Establishes a moat no competitor can replicate quickly — six years of encoded diligence knowledge scaling to 100,000+ decision nodes across five DD verticals.
"Traditional due diligence takes 88 hours and costs $150K+. We cut that to 23 hours with AI, and every engagement feeds a compounding data asset that unlocks seven additional revenue streams — projected at $45M in revenue on a $4.7M investment, profitable by Month 7. The lower middle market — 200,000+ companies — gets institutional-grade DD for the first time. I want to walk you through the full thesis, the economics, and why now is the moment to move."
The Problem
88 hrs
Per traditional DD engagement
The Solution
23 hrs
With AI-assisted platform
Total Build Cost
$4.7M
3-person team + AI tools
5-Year ROI
855%
$40.4M net / $4.7M invested
Executive Summary
Valeon Partners is building an AI-powered due diligence platform that transforms one-time consulting engagements into a compounding private company intelligence dataset.
The platform cuts due diligence delivery time by 74% (88 → 23 hours), enables a $3.5K automated tier that opens the $7B lower middle market, and generates eight revenue streams — six of which project to $45.1M over five years on a $4.7M investment (855% ROI).
The Problem
DD Is Too Slow & Expensive
Traditional engagements: 4-8 weeks, 88+ consultant hours, $150K+ cost. Lower middle market companies ($10-50M revenue) are priced out entirely — they get no institutional-grade DD.
Intelligence Dies in a PDF
Every DD engagement produces valuable company intelligence. Today it gets delivered as a static report and never used again. No benchmarks. No tracking. An estimated $2B+ in latent data value is discarded annually across the DD advisory market.
Deal Leads Found Too Late
PE firms discover targets through relationships. No data-driven pipeline exists for sourcing deals based on actual operational quality of private companies.
The Solution
AI-Powered DD Engine
Cut engagement time from 88 to 23 hours. Six specialized AI agents analyze documents, score findings, and generate reports. Consultants review and override — not write from scratch.
Compounding Data Asset
Every engagement feeds a scored, structured dataset. Industry benchmarks, marketplace listings, KPI tracking, and competitor scoring all emerge from the same data — growing more valuable with every engagement.
Capital Markets Deal Engine
High-scoring companies become fundraising mandates. Marketplace buyer intent reveals warm investors. An information advantage worth $5-15M in deal value annually.
Consultant Capacity
2.4x
More engagements per consultant
Engagement Time
74%
Reduction in delivery hours
Cap Markets Deals
$5-15M
Annual deal value from platform data
Breakeven
~7 mo
After launch to profitability
THE FLYWHEEL: More DD engagements → more scored companies → richer marketplace → more PE subscribers → more DD commissions → deeper benchmarks → higher-conviction cap markets deals → more co-investment opportunities → stronger brand → more companies seeking DD → repeat. Each revolution increases the value of every prior data point.
Market Opportunity
TAM
$26B
DD advisory + private data + PE tools
SAM
$7B
Lower/mid MM DD + PE data
SOM (Y5)
$22.5M
0.32% of SAM
Why now: Three converging forces make this the right moment. (1) LLM capabilities have reached the threshold where structured financial and technical analysis is viable — 86%2 of PE leaders are already using GenAI in M&A (Deloitte 2025). (2) LLM costs are deflating 50%+ annually, continuously improving unit economics. (3) The lower middle market remains unserved — no one has built the institutional-grade AI DD platform for $10-50M companies.
Competitive Advantage
| Dimension | Valeon Platform | Point-Solution Competitors |
|---|---|---|
| Scope | Full lifecycle: DD → Marketplace → KPI → Cap Markets | Single step: AI analysis only (Keye, ToltIQ, Brightwave) |
| DD Coverage | 6 DD types: ITDD, FDD, Commercial, Market, Compliance, Cyber | Typically 1 type (FDD or general) |
| Data Moat | Every engagement compounds the dataset; 7 downstream products | Analysis results not structured for reuse |
| Revenue Streams | 8 interlocking streams (6 modeled) | 1-2 (SaaS subscription or per-seat) |
| Go-to-Market | Existing Valeon PE client relationships — no cold start | Raising capital to build sales teams from scratch |
| Lower MM Access | $3.5K automated tier opens underserved market | Enterprise pricing ($20K+) or per-seat ($500/mo) |
Go-to-Market Strategy
Phase 1: Existing Relationships (Months 1-6)
Channel: Direct sales via Valeon Partners' existing PE and portfolio company relationships. Consultant-led demos using real (anonymized) engagement examples.
Target: 10-20 AI-Assisted engagements at $15K-$40K. Validate the product with trusted clients who will provide candid feedback.
Budget: $30K (conferences, collateral, demo environment).
Phase 2: Market Expansion (Months 7-18)
Channel: ACG/PEI conference presence for enterprise ($50K+ tier). Content marketing and SEO for self-serve ($3.5K tier). Marketplace launch creates its own demand — PE subscribers attract companies seeking visibility.
Target: 60-150 engagements across all tiers. First marketplace subscribers. First KPI SaaS contracts.
Budget: $80K-$150K (scaling with revenue).
Phase 3: Platform Scale (Months 18-36)
Channel: Dedicated sales team for enterprise PE firms. Partner channel (accounting firms, law firms). Capital markets deal flow generates its own inbound.
Target: 300-500 engagements/year. Capital markets generating $2-4M in IB fees. Licensing discussions with other advisory firms.
Budget: $250K-$350K (with 90%+ operating margins funding growth).
Phase 4: Data Dominance (Year 3-5)
Channel: The data asset becomes the go-to-market. "Valeon Certified" as an industry standard. Benchmark reports sold to investors, boards, and operators. Licensing the platform to advisory firms globally.
Target: 1,000+ scored companies. Certification program launched. Data asset valued at $15-41M standalone.
Budget: Funded by 90%+ operating margins.
Financial Summary
| Year 1 | Year 2 | Year 3 | Year 4 | Year 5 | 5-Year | |
|---|---|---|---|---|---|---|
| Engagements | 20 | 60 | 150 | 300 | 500 | 1,030 |
| Revenue | $872K | $2.55M | $6.12M | $13.12M | $22.46M | $45.1M |
| Platform Costs | $484K | $603K | $858K | $1.20M | $1.58M | $4.73M |
| Net Income | $388K | $1.95M | $5.26M | $11.92M | $20.88M | $40.4M |
| Operating Margin | 44% | 76% | 86% | 91% | 93% | 90% |
5-Year ROI
855%
$40.4M net / $4.73M invested
Breakeven
Month 7
Profitable in Year 1
Data Asset (Y5)
$15-41M
Standalone valuation
Total Value Created
$84-120M
Revenue + savings + data + equity
Revenue excludes two unmodeled streams: Equity/Co-Investment ($5-15M portfolio over 5 years) and Certifications ("Valeon Certified" standard). These represent strategic upside above the $45.1M base model.
Team & Hiring Plan
| Role | When | Annual Cost | Responsibility |
|---|---|---|---|
| Lead Data & AI Architect | Month 1 | $180K | System architecture, RAG pipeline, AI agents, LLM Gateway, Rules Engine, data modeling. The technical co-founder equivalent. |
| Junior Developer #1 | Month 1 | $80K | Backend API services, database, auth, infrastructure. Grows into backend lead. |
| Junior Developer #2 | Month 1 | $80K | Frontend UI (AI-assisted), component library, integrations. Grows into frontend lead. |
| Contract UX Designer | Month 1-6 | $30K total | Information architecture, component design, Valeon brand system. Transitions to on-call retainer. |
| Senior Backend Engineer | Month 9 | $150K | Marketplace, integrations, performance. Hire #4 as V1 ships. |
| DevOps / SRE | Month 12 | $140K | SOC 2 compliance, monitoring, CI/CD optimization, scale planning. Hire as SOC 2 audit approaches. |
| Sales / BD Lead | Month 12 | $120K + comm. | Enterprise PE sales, conference presence, partner channel development. Hire as engagement volume exceeds founder-led sales capacity. |
Key advantage: AI pair-programming tools (~$6K/year) provide 2-3x frontend development velocity for the junior developers. This allows a 3-person team to operate with the output of a 5-6 person team during the critical MVP phase.
Funding Framework
Current model assumes self-funded from operating cash flow, leveraging Valeon Partners' existing revenue and client base. The lean cost structure ($484K Y1) and early profitability (Month 7) make this viable without external capital. However, two scenarios would warrant raising:
Scenario A: Acceleration Round ($2-3M)
Trigger: MVP validation confirms product-market fit (10+ paying engagements, positive NPS from PE clients).
Use of funds: Accelerate hiring (5→10 engineers), aggressive GTM ($500K+ marketing), pursue SOC 2 Type II immediately, and build integrations faster to lock in enterprise PE firms before Keye/ToltIQ.
Target investors: Vertical SaaS funds, PE-focused fintechs, strategic PE firms (LP investment).
Expected terms: $10-15M pre-money based on $872K ARR and data asset trajectory.
Scenario B: Competitive Response ($5-8M)
Trigger: A funded competitor (Keye, Brightwave) achieves significant traction and threatens to build the marketplace/data moat first.
Use of funds: Blitz-scale engagements (subsidize $3.5K tier to acquire data), acquire a complementary dataset or tool, hire enterprise sales team, and establish "Valeon Certified" brand before competitors.
Target investors: Growth equity, strategic acquirer (Datasite, S&P Global, Moody's).
Expected terms: $25-40M pre-money based on data asset and revenue growth trajectory.
Key Milestones
Month 4
MVP Launch — First live ITDD engagement processed end-to-end with AI assistance. Technology Agent scoring validated against 3-5 real engagements.
Month 7
Breakeven — Platform operating costs covered by engagement revenue. Positive unit economics demonstrated.
Month 9
V1 Launch — All 6 AI agents live. Marketplace accepting listings. KPI tracking active. First $3.5K automated tier engagement completed.
Month 12
Data Milestone — 60+ scored companies in dataset. First industry benchmarks generated. SOC 2 Type I audit completed. 100+ marketplace score threshold for self-service tier credibility.
Month 15
Cap Markets Active — First capital markets deal sourced from platform intelligence. DealCloud integration live with first enterprise PE firm.
Month 18
V2 Complete — Full platform operational. Mobile experience live. 150+ engagements completed. Platform-triggered services generating measurable revenue.
Year 3
Scale Inflection — 300 engagements/year. Data asset reaches critical mass for competitor scoring. "Valeon Certified" discussions begin. Licensing conversations with other advisory firms.
Year 5
Platform Dominance — 500 engagements/year, $22.5M revenue, 93% margin, 1,030+ scored companies, $15-41M data asset. Category-defining position in AI-powered private company intelligence.
The Ask:
This plan is executable with Valeon Partners' existing resources + 2 additional hires. The initial investment is $484K (In salary) (Year 1) — recoverable by Month 7. If the MVP validates, the decision point for external capital (Scenario A or B) comes with real data, paying customers, and a compounding dataset — dramatically improving terms and reducing dilution compared to raising pre-product.
Platform Flywheel — Cyclical Value Creation
"This is the diagram that explains why the platform compounds. There are two interlocking cycles. The inner cycle is what happens during a single engagement — documents go in, intelligence comes out. The outer cycle is the flywheel: every engagement makes the platform smarter, which makes the output better, which attracts more engagements. The key insight is that the outer cycle feeds seven additional revenue streams beyond the initial project fee. A PE firm pays for one DD — but that engagement generates marketplace data, KPI tracking revenue, services leads, competitor benchmarks, and capital markets deal flow. That's what turns a consulting tool into a compounding data business."
The Platform Flywheel (Outer Cycle)
Each engagement doesn't just produce a report — it feeds the data asset, enriches the Knowledge Graph, and unlocks revenue streams that compound over time. The flywheel accelerates: more data means better AI output, which means more demand, which means more data.
Single Engagement Cycle (Inner Loop)
This is what happens inside every engagement. Each step maps to a specific system component, and the output of each step feeds the next. The entire process is deterministic — the Knowledge Graph controls what the AI evaluates.
How the Cycles Interlock
Inner Cycle (Per Engagement)
Documents in → AI classifies → Knowledge Graph evaluates → Findings generated → Recommendations costed → Scored report delivered. Time: 23 hours (vs. 88 hours manual). Deterministic, auditable, repeatable.
Documents in → AI classifies → Knowledge Graph evaluates → Findings generated → Recommendations costed → Scored report delivered. Time: 23 hours (vs. 88 hours manual). Deterministic, auditable, repeatable.
Outer Cycle (Platform Flywheel)
Client hires → Engagement runs → Data captured → Revenue streams unlock → Better output attracts more clients → Repeat. Each cycle adds a scored company to the dataset and refines the Knowledge Graph. By Year 5: 1,030+ companies.
Client hires → Engagement runs → Data captured → Revenue streams unlock → Better output attracts more clients → Repeat. Each cycle adds a scored company to the dataset and refines the Knowledge Graph. By Year 5: 1,030+ companies.
The Compounding Effect
Year 1: 20 engagements, $872K, basic dataset. Year 5: 500 engagements, $22.5M, 1,030+ scored companies, $15–41M data asset, category-defining intelligence platform. Same inner cycle, exponentially more valuable outer cycle.
Year 1: 20 engagements, $872K, basic dataset. Year 5: 500 engagements, $22.5M, 1,030+ scored companies, $15–41M data asset, category-defining intelligence platform. Same inner cycle, exponentially more valuable outer cycle.
The Key Insight: Every competitor can build the inner cycle — document processing and AI analysis. No competitor has the outer cycle because it requires the 21,224-node Knowledge Graph (6 years to build), the eight interlocking revenue streams, and the compounding data asset. The inner cycle produces reports. The outer cycle produces a monopoly.
The Logic Engine — 6 Years of Knowledge Architecture
"I want to be direct about what you're really investing in here. The application — the UI, the dashboards, the login screen — that's a few months of engineering. What took six years is what's behind it: a 21,000-node decision graph that I built by hand, one indicator at a time, from live engagement data across dozens of real technology due diligence projects. Every time I sat across the table from a CTO and evaluated their architecture, every risk I surfaced, every recommendation I costed out — I encoded that judgment into this system. There are 1,279 IF/THEN evaluation points, each one written because I saw the real-world consequence of missing it. There are 1,097 pre-mapped findings tied to 641 costed recommendations with implementation timelines. There are 10,808 technology items cataloged and 237 compliance framework references cross-linked to every relevant indicator. A competitor can hire a dev team tomorrow and build a better-looking app by next quarter. They cannot manufacture six years of institutional diligence knowledge. And this is only Technology DD — we need four more graphs of equal depth for Financial, Commercial, Cyber, and Market. That's the moat."
Total Decision Nodes
21,224
Technology DD only
Years of Development
6
Built from live engagements
DD Verticals to Map
5
Tech · Finance · Commercial · Cyber · Market
Est. Total at Scale
100K+
All 5 verticals fully mapped
What Makes This a Knowledge Graph — Not a Rules Engine
A rules engine is a flat list of IF/THEN checks. What I've built is a multi-layered relational graph where every node is connected to nodes above it, below it, and across tracks. A single VDR document doesn't just trigger one check — it activates a cascade across interconnected layers, each one contextualizing the next.
WHAT COMPETITORS HAVE
Flat checklists. Generic prompts. "Analyze this document for risks." The AI hallucinates findings based on whatever its training data contains. No structure, no scoring taxonomy, no traceability. Every engagement starts from zero. Output quality depends entirely on prompt engineering — and it's different every time.
WHAT THE KNOWLEDGE GRAPH PROVIDES
A deterministic evaluation framework. The AI doesn't decide what to look for — the graph tells it. 1,279 specific indicators, each mapped to expected findings, each linked to pre-costed recommendations. Output is consistent, auditable, and defensible because every finding traces back through indicator → topic → track to its source document. The graph turns AI from a guessing machine into a structured analyst.
How the Knowledge Graph Connects VDR Documents to Report Output
Each layer represents a database table. Lines show how a single document fragment flows through the decision engine — branching, evaluating, and converging into actionable output. Hover over any node to see its role.
By the Numbers — The Scale of What's Been Built
These aren't placeholder counts. Every number below represents a hand-authored, peer-reviewed decision node — written, revised, and validated across dozens of live engagements over six years.
126
Data fields per node
across 10 tables
712
Essential indicators
required every engagement
378
Indicators revised 2+ times
refined from engagement data
354
Critical + High risks mapped
each with business impact
237
Compliance references
ISO · HIPAA · CIS · NIST
10,808
Unique tech items cataloged
across 54+ categories
532
Recs with cost estimates
OTC + annual cost ranges
109
Cross-track topics
non-linear evaluation paths
Depth of Coverage — Where the Work Lives
Not every track is equal. Some domains required hundreds of indicators because the evaluation surface area is massive. This table shows the eight deepest tracks — the ones where the most diligence judgment is encoded.
| Track | Category | Topics | Indicators | Findings | Recs | Coverage Depth |
|---|---|---|---|---|---|---|
| Compliance | Process | 49 | 226 | 1 | 0 | |
| Enterprise Systems | Technology | 19 | 97 | 80 | 49 | |
| Product Security | Process | 18 | 86 | 86 | 51 | |
| Software App Architecture | Technology | 20 | 75 | 98 | 49 | |
| SDLC | Process | 10 | 59 | 79 | 43 | |
| Enterprise Security & Gov | Process | 26 | 57 | 181 | 104 | |
| Product Management | Process | 14 | 49 | 36 | 22 | |
| AI & Machine Learning | Technology | 15 | 30 | 30+ | 20+ |
Note: Compliance has 226 indicators but only 1 finding and 0 recommendations because its indicators map directly to regulatory framework checks (ISO, HIPAA, CIS, NIST) rather than producing traditional findings — compliance gaps surface through cross-linked tracks like Enterprise Security and Product Security. Enterprise Security has only 57 indicators but produces 181 findings and 104 recommendations — the highest finding-to-indicator ratio in the graph. This is because security issues are multi-dimensional: a single missing control can produce multiple risk findings across confidentiality, integrity, and availability.
The 10 Interconnected Data Tables
Every node in the graph lives in one of 10 purpose-built database tables. Together they form a relational knowledge graph where a single VDR document can trigger evaluation paths across hundreds of indicators, each branching into findings, recommendations, and costed value-creation initiatives.
1. Tracks (39 rows × 20 fields)
Top-level evaluation domains. 13 Technology tracks, 25 Process tracks, 1 People track. Each has its own reference prefix (ARCH, INFR, SDLC), 8 report-section toggles, and category classification. Tracks span from foundational (Software Architecture, active since 2022) to cutting-edge (AI Disruption, Market Fit & Expansion, added Feb 2026).
Top-level evaluation domains. 13 Technology tracks, 25 Process tracks, 1 People track. Each has its own reference prefix (ARCH, INFR, SDLC), 8 report-section toggles, and category classification. Tracks span from foundational (Software Architecture, active since 2022) to cutting-edge (AI Disruption, Market Fit & Expansion, added Feb 2026).
2. Topics (394 rows × 11 fields)
Sub-categories within each track, each weighted and scored independently. Compliance alone has 49 topics. 109 topics are shared across multiple tracks — e.g., "User Interface/User Experience" appears in App Architecture, Product Management, and Preliminary Architecture simultaneously, creating non-linear evaluation paths. Topic data spans from 2015 to 2025.
Sub-categories within each track, each weighted and scored independently. Compliance alone has 49 topics. 109 topics are shared across multiple tracks — e.g., "User Interface/User Experience" appears in App Architecture, Product Management, and Preliminary Architecture simultaneously, creating non-linear evaluation paths. Topic data spans from 2015 to 2025.
3. Indicators (1,279 rows × 12 fields)
The core IF/THEN logic — the heart of the knowledge graph. 712 Essential (every engagement) + 567 Additional (premium). 4 depth tiers: Core (501), Light (461), Deep (240), Premium (77). 378 indicators have been revised multiple times — some up to 9 versions — refined from what we learned in live engagements. Each one versioned, dated, and tagged with compliance framework references.
The core IF/THEN logic — the heart of the knowledge graph. 712 Essential (every engagement) + 567 Additional (premium). 4 depth tiers: Core (501), Light (461), Deep (240), Premium (77). 378 indicators have been revised multiple times — some up to 9 versions — refined from what we learned in live engagements. Each one versioned, dated, and tagged with compliance framework references.
4. Findings (1,097 rows × 10 fields)
What the indicators discover: 457 Strengths, 421 Risks, 219 Opportunities. Each finding carries a brief summary, full description, business impact statement, risk severity (4 Critical, 350 High, 226 Medium, 60 Low), approval status, and linked recommendation chain. Every finding is pre-written from experience — the AI selects and contextualizes, it doesn't hallucinate.
What the indicators discover: 457 Strengths, 421 Risks, 219 Opportunities. Each finding carries a brief summary, full description, business impact statement, risk severity (4 Critical, 350 High, 226 Medium, 60 Low), approval status, and linked recommendation chain. Every finding is pre-written from experience — the AI selects and contextualizes, it doesn't hallucinate.
5. Recommendations (641 rows × 15 fields)
Actionable remediation and value-creation steps. 15 data fields per recommendation: brief + full text, business value, priority (16 Critical / 221 High / 245 Medium / 50 Low), duration (from <1 month to 12+ months), one-time cost, annual cost, VC opportunity flag, linked finding, approval status, and implementation guide URL. This is not "the AI suggests" — this is pre-costed, pre-prioritized, consultant-grade output.
Actionable remediation and value-creation steps. 15 data fields per recommendation: brief + full text, business value, priority (16 Critical / 221 High / 245 Medium / 50 Low), duration (from <1 month to 12+ months), one-time cost, annual cost, VC opportunity flag, linked finding, approval status, and implementation guide URL. This is not "the AI suggests" — this is pre-costed, pre-prioritized, consultant-grade output.
6. Tech Items (17,145 assignments / 10,808 unique)
A comprehensive technology catalog: Back-End Languages (537), Front-End Frameworks (477), Databases (760), Vulnerability Management (498), Encryption (381), CI/CD (198), Configuration Automation (317), Device Controls (321), and 46 more categories. Each item is ranked, status-tracked (approved/proposed), and linked to the tracks where it appears. This lets the AI instantly recognize any technology a target company uses.
A comprehensive technology catalog: Back-End Languages (537), Front-End Frameworks (477), Databases (760), Vulnerability Management (498), Encryption (381), CI/CD (198), Configuration Automation (317), Device Controls (321), and 46 more categories. Each item is ranked, status-tracked (approved/proposed), and linked to the tracks where it appears. This lets the AI instantly recognize any technology a target company uses.
7–8. Categories & Tags (84 + 357 rows)
84 tech item categories across every track. 357 compliance and industry tags: 92 ISO 27001 clauses, 110 HIPAA §164.xxx sections, 18 CIS controls, NIST references, plus 53 industry group tags. These auto-link indicators to regulatory frameworks — so when the AI evaluates an encryption indicator, it knows exactly which ISO 27001, HIPAA, and CIS controls are relevant.
84 tech item categories across every track. 357 compliance and industry tags: 92 ISO 27001 clauses, 110 HIPAA §164.xxx sections, 18 CIS controls, NIST references, plus 53 industry group tags. These auto-link indicators to regulatory frameworks — so when the AI evaluates an encryption indicator, it knows exactly which ISO 27001, HIPAA, and CIS controls are relevant.
9–10. Metrics & Value Creations (170 + 102 rows)
170 KPIs with tooltips, measurement units, pre-filled defaults, and cross-track configuration: MTBF, MTTR, RTO, RPO, deployment frequency, test coverage, code quality scores, and 160+ more. 102 value-creation initiatives — each linking a finding → recommendation → OTC + annual cost + risk level + business impact + implementation guide URL. This is the "so what" layer that turns findings into investable action.
170 KPIs with tooltips, measurement units, pre-filled defaults, and cross-track configuration: MTBF, MTTR, RTO, RPO, deployment frequency, test coverage, code quality scores, and 160+ more. 102 value-creation initiatives — each linking a finding → recommendation → OTC + annual cost + risk level + business impact + implementation guide URL. This is the "so what" layer that turns findings into investable action.
The Compounding Advantage
YEAR 1–2 (2020–2022)
Built the foundational tracks: App Architecture, Delivery Infrastructure, SDLC, Enterprise Security. Created the first ~400 indicators and the relational data model. Established the Track → Topic → Indicator → Finding → Recommendation hierarchy. Data spans back to 2015 from prior consulting work that was retroactively structured.
YEAR 3–4 (2023–2024)
Expanded to 39 tracks with specialized domains: AI/ML, Data Architecture, Compliance (226 indicators alone), CIS + NIST cybersecurity frameworks. Added the tech item catalog (10,808 items), compliance tag cross-linking (237 regulatory references), and the value creation layer. Indicator revisions accelerated — 378 indicators revised 2+ times based on engagement learnings.
YEAR 5–6 (2025–2026)
Added next-generation tracks: AI Disruption, Product Competitiveness, Market Fit & Expansion, Product Strategy Execution. These reflect the emerging reality that every TDD now requires AI readiness evaluation. The graph now covers 21,224 nodes — and every new engagement adds signal that refines indicator weights, finding severity, and recommendation costing.
Why This Is the Moat: A competitor can build the UI in months. They cannot manufacture 21,224 hand-mapped decision nodes refined across 6 years of real engagement data. Every indicator exists because I saw the real-world consequence of missing it. Every finding was written because I delivered it to a client. Every recommendation was costed because a PE firm asked "what will this take to fix?" This institutional knowledge compounds — and when we replicate it across Financial, Commercial, Cyber, and Market DD at the same depth, the total graph exceeds 100,000 nodes. That is an insurmountable data advantage.
Example 1: CI/CD Pipeline Config Through the Graph
1VDR Upload: Client uploads
.gitlab-ci.yml — a CI/CD pipeline configuration2Track Classification: AI routes to SDLC (Track 9) + Delivery Infrastructure (Track 6)
3Topic Activation: Release Management (9 indicators), Process Management (11), Automation, Observability (4)
4Indicator Evaluation: 24+ IF/THEN checks — "Does the release process support rollback?", "Is deployment frequency tracked?", "Are environments properly isolated?"
5Findings: Strength (automated deployments), Risk (no rollback, single environment), Opportunity (blue-green deployment)
6Recommendation: "Implement blue-green deployment" — High priority, 1–3 months, OTC: $10K–$50K + guide URL
7Report: Finding scored, tagged with CIS/NIST if applicable, cost modeled, placed in TDD report with full provenance chain
Example 2: Security Incident Response Policy
1VDR Upload: Client uploads an Incident Response Plan PDF and employee security training records
2Track Classification: AI routes to Enterprise Security & Governance (Track 10) + Product Security (Track 34) + Compliance (Track 13)
3Topic Activation: Incident Management, Vulnerability Management, Data Loss Prevention, Encryption — spanning 26 topics across 3 tracks simultaneously
4Indicator Evaluation: 57+ indicators fire across Enterprise Security alone — cross-linked with 92 ISO 27001 clauses and 110 HIPAA §164.xxx references automatically
5Findings: 181 possible findings in this track — e.g., Risk: "No documented incident escalation procedure" (High severity, business impact: regulatory exposure)
6Recommendations: 104 possible in this track — e.g., "Establish and test incident response runbook" — Critical priority, <1 month, OTC: $1K–$10K
7Report: Findings mapped to specific ISO 27001 A.16.x and HIPAA §164.308(a)(6) references, compliance gap analysis auto-generated, value creation initiative costed
Multiply Across Every Document: A typical VDR contains 200–2,000 documents. Each one flows through this same graph, activating different tracks, topics, and indicators. The AI doesn't guess — it follows 1,279 decision paths I've mapped, producing findings that are consistent, defensible, and traceable. Every finding has a provenance chain: VDR document → indicator → finding → recommendation → cost estimate → compliance tag. That's what makes this auditable — and that's what took six years to build.